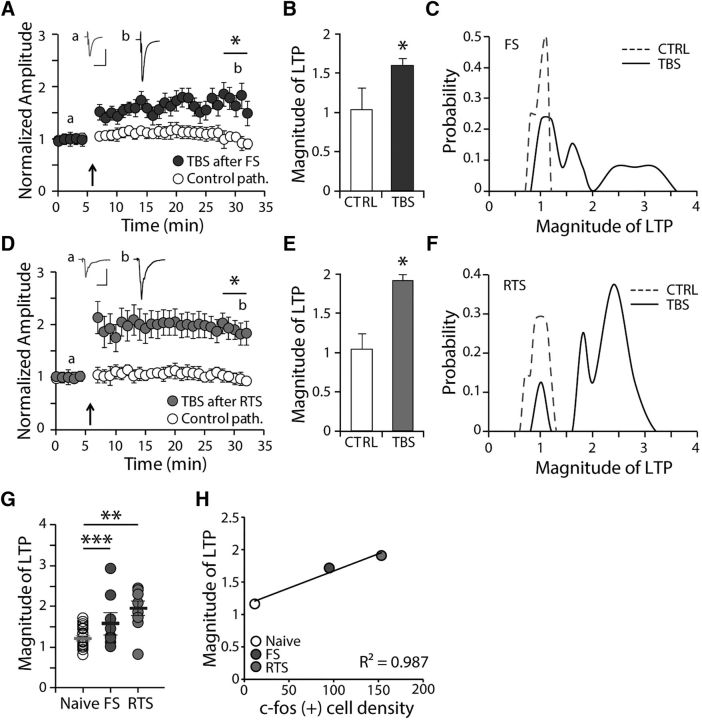
Figure 5.
Exposure to stressors facilitates the induction of LTP in the LHb and alters the propensity for potentiation in the LHb. A, Summary of normalized amplitudes of eEPSCs before and after TBS in FS-exposed animals. Calibration: 20 ms, 100 pA. B, Averaged magnitude of LTP measured 30 min after TBS. After TBS, the amplitude of eEPSC was further potentiated in FS animals compared with naive animals (154.7 ± 20% of baseline, n = 13, p < 0.05). C, The probability plot for the magnitude of LTP in FS-exposed animals compared with naive animals. D, Summary of normalized amplitudes of eEPSCs before and after TBS in RTS-exposed animals. Calibration: 20 ms, 100 pA. E, Averaged magnitude of LTP measured 30 min after TBS. After TBS, the amplitude of eEPSC was further potentiated in RTS animals compared with naive animals (191.1 ± 19% of baseline, n = 8, p < 0.05). F, The probability plot for the magnitude of LTP in RTS-exposed animals compared with naive animals. G, Comparison of the magnitude of LTP in the stimulated pathway in individual experiments between naive, FS-exposed, and RTS-exposed groups (one-way ANOVA test, F(2,36) = 5.44, p < 0.01). The sample variances were 0.08, 0.52, and 0.29 for the naive, FS-, and RTS-exposed groups, respectively (F test, p < 0.01). H, Correlation between c-fos-positive cell density and magnitude of LTP (R2 = 0.987). *p < 0.05. **p < 0.01. ***p < 0.001.

