
Figure 8.
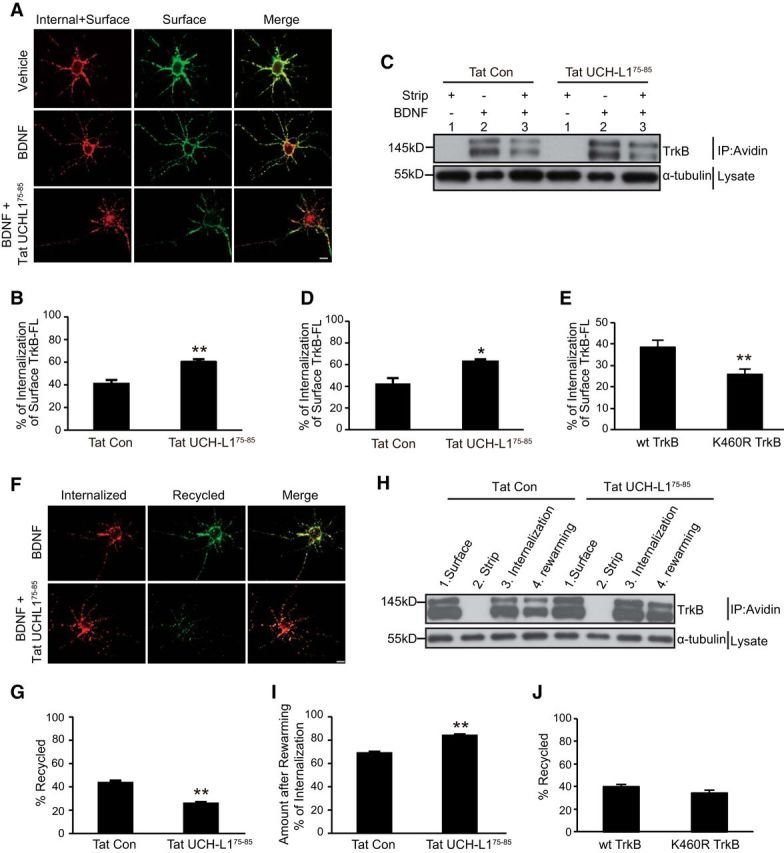
Ubiquitination of TrkB facilitates BDNF-induced TrkB-FL internalization. A, Representative epifluorescence images from the TrkB-FL internalization assay. Scale bar, 20 μm. B, Quantification of internalized TrkB levels in A was performed as described in the Materials and Methods. All data are presented as mean ± SEM determined from analysis of more than three independent experiments (n = 30 cells for each condition per independent experiment). **p < 0.01, Student's t test. C, Representative images from the cleavable surface biotinylation assay (see Materials and Methods for details). Lane 1 shows the efficiency of the stripping procedure; lane 2 shows the total biotinylated TrkB-FL receptors at the neuronal surface; lane 3 shows the internalized biotinylated TrkB receptors. D, Quantification of internalized TrkB levels in C was performed as described in the Materials and Methods. All data are presented as mean ± SEM determined from analysis of more than three independent experiments. *p < 0.05, Student's t test. E, Quantification of internalized K460R TrkB-FL levels performed by epifluorescence internalization assay. All data are presented as mean ± SEM from three independent experiments (n = 30 cells for each condition per independent experiment). **p < 0.01, Student's t test. F, Representative epifluorescence images from the TrkB-FL postendocytic recycling assay. Scale bar, 20 μm. G, Quantitative analysis of recycled TrkB receptors as described in E. Graphs represent mean ± SEM determined from results of more than three independent experiments (n = 30 cells for each condition per independent experiment). **p < 0.01, Student's t test. H, Representative data from the cleavable surface biotinylation assay (see Materials and Methods for details). Lane 1 shows the total biotinylated TrkB receptors at neuronal surface; lane 2 shows the efficiency of the stripping procedure; lane 3 shows the internalized biotinylated TrkB receptors; lane 4 shows the un-recycled TrkB receptors during the rewarming period. I, Densitometric quantitation of un-recycled biotinylated TrkB receptor levels in G. Bar graphs represent mean ± SEM (n > 3). **p < 0.01, Student's t test. J, Quantitative analysis of recycled K460R TrkB receptors as performed by live-cell epifluorescence recycling assay. Graphs represent mean ± SEM from three independent experiments (n = 30 cells for each condition per independent experiment).