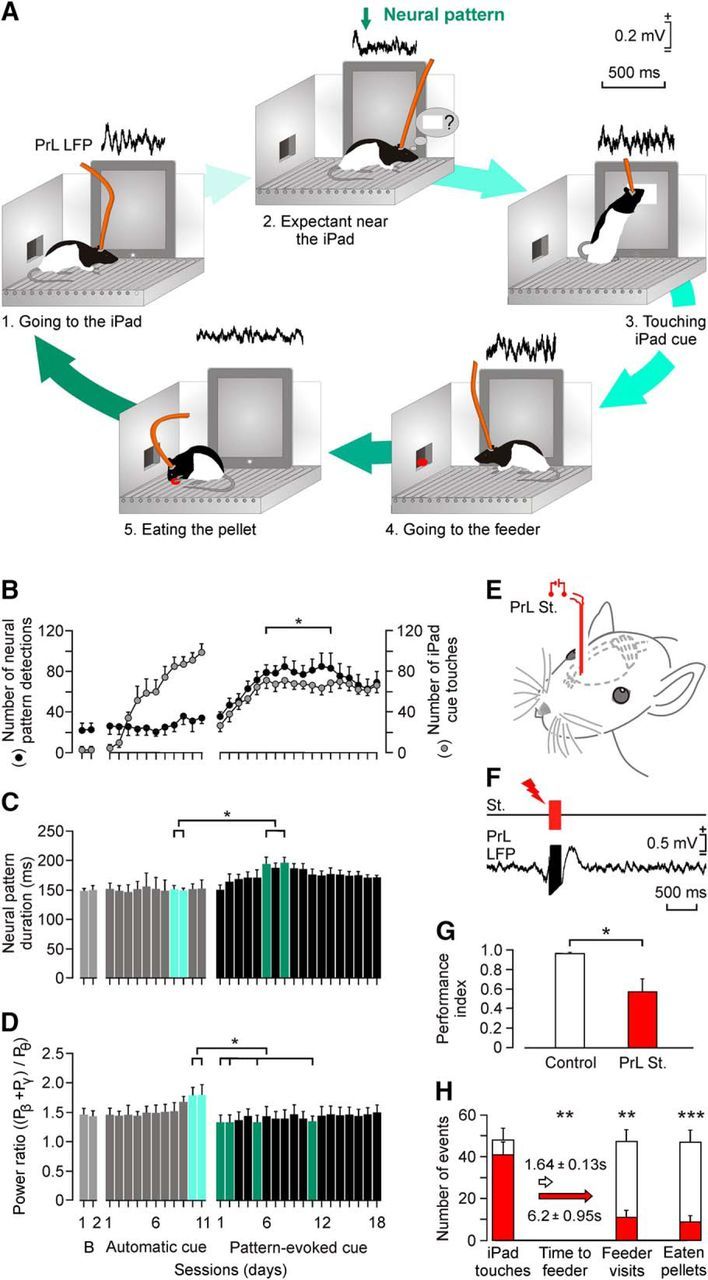
Figure 5.

Evolution of the selected θ/β-γ transition pattern across training with the touch-screen task. A, A diagram of behaviors performed by the experimental animal during a complete sequence of operant conditioning with the touch screen. The corresponding LFP evoked in the PrL cortex during the corresponding behavior is illustrated above each sketch. B, Evolution of the number of screen touches during baseline recordings, when the square virtual button display appeared spontaneously on the touch screen (Automatic cue) and when its appearance was triggered by the θ/β-γ transition pattern recorded in the PrL cortex (Pattern-evoked cue). Data collected and averaged from 10 animals. Note that pattern presentation showed no significant (p > 0.05) changes during automatic cue sessions, but increased significantly (F(1,9,339) = 30.096, p ≤ 0.001, 2-way ANOVA) for pattern-evoked cue sessions. C, Evolution of pattern duration across training sessions illustrated in B. Note the slight increase in duration across the first sessions in which the pattern was used to trigger the visual display on the touch screen. Significant differences are indicated (χ2 = 47.098; degrees of freedom, 30; p ≤ 0.05, Friedman test). This increase in pattern duration disappeared after the first 10 pattern-evoked cue sessions. D, Evolution of the power ratio [(Pβ + Pγ)/Pθ] across training sessions. Power ratio was larger for automatic than for pattern-evoked cue sessions. Significant differences are indicated (χ2 = 55.423; degrees of freedom, 30; p ≤ 0.05, Friedman test). E, F, Experimental design for animal stimulation in the PrL cortex. The experimental animal was stimulated for 200 ms (50 μs pulses at 200 Hz) the moment it touched the screen. A total of five rats/group was used. G, Differences in the performance index [index: (Nfeeder + Neat)/(Nfeeder + Ntouches), where N = number of events]. Control rats reached an index of 0.97 ± 0.01 (white bar), while stimulated rats reached significantly lower values (0.58 ± 0.15, t(8,0.05) = 2.586, p ≤ 0.05, Student's t test). H, Other quantitative differences in operant conditioning performance between the control and the stimulated groups. Although the number of screen touches was similar for the two groups (t(8,0.05) = 1.043; p = 0.328; Student's t test), the stimulated group spent a significantly longer time reaching the feeder (p = 0.001; Mann–Whitney rank sum test), paid fewer visits to the feeder (t(8,0.05) = 5.008, p < 0.001, Student's t test), and ate fewer pellets (t(8,0.05) = 5.334, p < 0.001, Student's t test).
