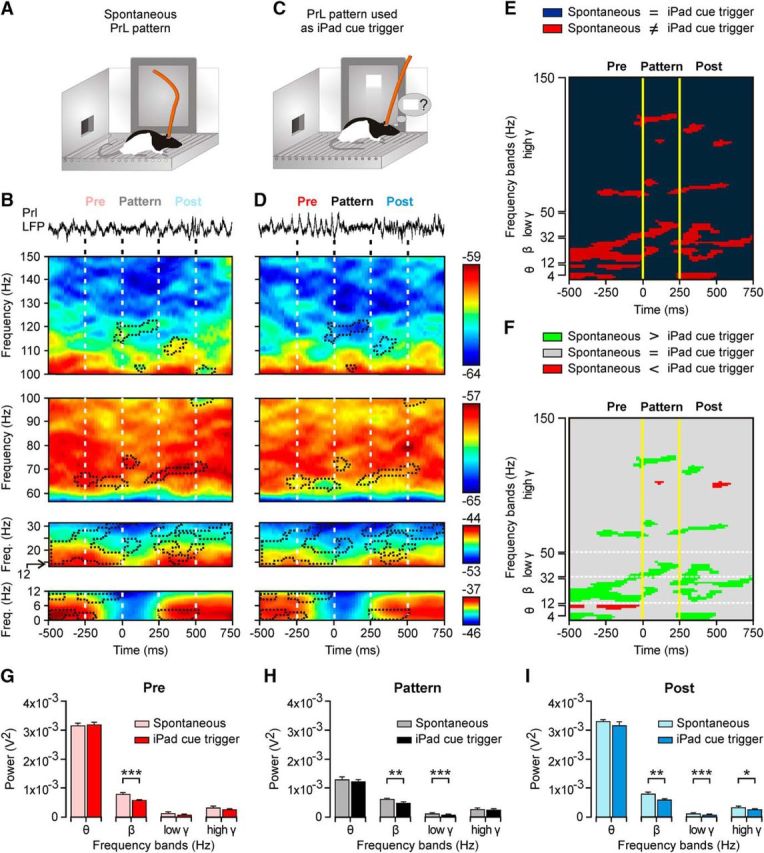
Figure 8.

Differences in the spectral properties of the selected θ/β-γ transition pattern when generated spontaneously and when used to trigger touch-screen cues. A, As illustrated in Figure 5B–D, the spontaneous presentation of the θ/β-γ transition pattern during the automatic presentation of the visual (square virtual button) cue on the touch screen was recorded. B, At the top is illustrated a representative example of LFPs, including the presence of the θ/β-γ transition pattern evoked spontaneously. Below are illustrated time–frequency representations averaged from 150 traces (n = 5 rats), including the selected pattern recorded from automatic cue sessions. C, D, The same as for A and B, but corresponding to LFPs recorded during pattern-evoked cue operant conditioning sessions (150 traces collected from 10 rats). Areas surrounded by dots correspond to observed differences between the two time–frequency displays. E, Significant differences (p ≤ 0.05) between the averaged time–frequency displays illustrated in B and D. F, Same as in E, but indicating when the spectral power was larger for θ/β-γ patterns evoked spontaneously (green areas) versus those cases in which the spectral power was larger for patterns used to trigger the visual cue (red areas). G–I, Spectral analysis for LFPs collected before (Pre, G), during (Pattern, H), and after (Post, I) for data illustrated in B and D. Significant differences are indicated. *p < 0.05; **p < 0.01; ***p < 0.001, Student's t test.
