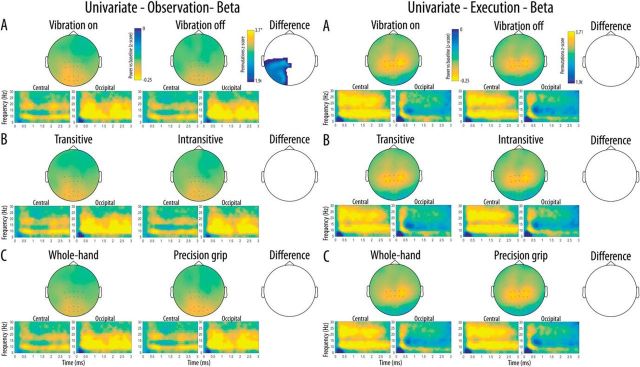
Figure 4.
Scalp distribution of the beta suppression relative to baseline for the two levels of each Condition (A, Vibration; B, Transitivity; C, Action type) as a function of Modality (Left, Execution; Right, Observation). The difference maps show clusters of channels with significant main effects surviving correction for multiple comparisons for each Condition and Modality. Time-frequency plots show the time course of frequency activity at the central and occipital clusters of interest. Channels included in these clusters are marked on the scalp maps.

