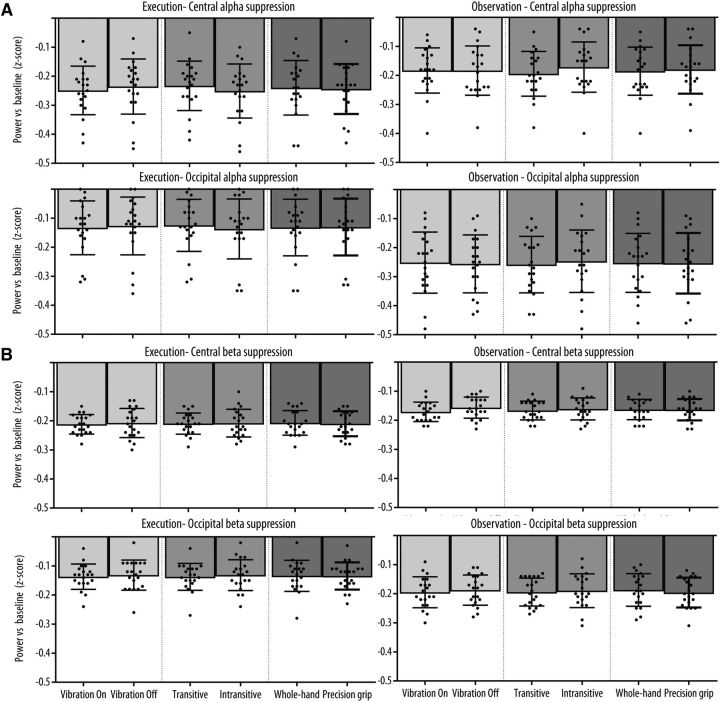
Figure 5.
Mean (A) alpha and (B) beta suppression relative to baseline for the two levels of each Condition (Vibration, Transitivity, Action type) as a function of Modality (Left, Execution; Right, Observation) and Location (Left column, Central; Right column, Occipital). Error bars indicate 95% CI. Black dots indicate the mean suppression for each subject.

