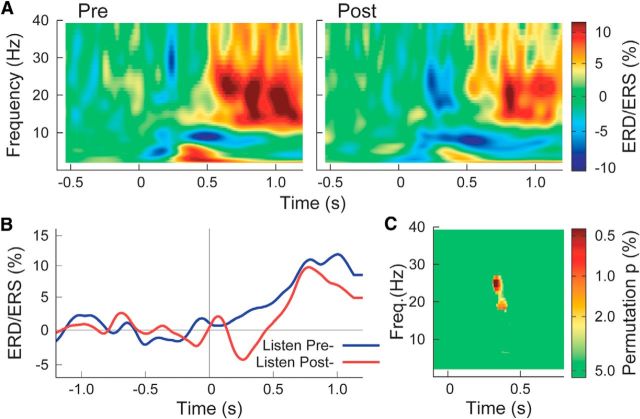
Figure 8.
Event-related power changes in left sensorimotor cortex. A, Grand averaged time–frequency maps of ERD/ERS during passive listening before and after the active task. B, Grand averaged time series of β (15–25 Hz) changes, showing β decrease in the second listening block. C, P values from a permutation test show significant differences between both time–frequency maps in the β range ∼300 ms after sound onset.

