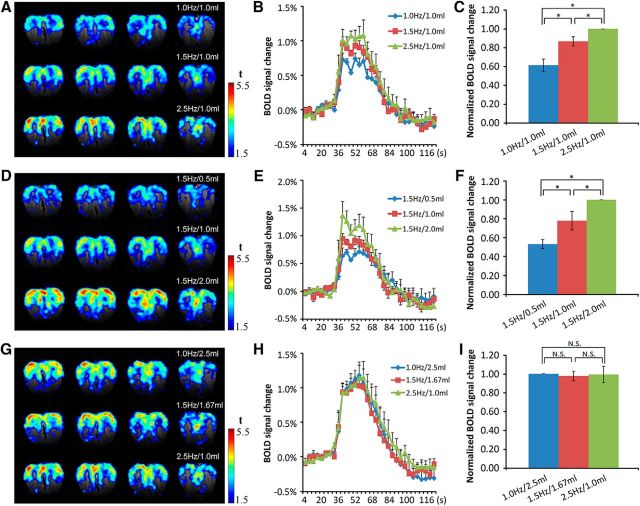
Figure 4.
BOLD responses to different mechanical stimuli in the OB. A–C, Model I: The elicited BOLD patterns (A), corresponding time courses of BOLD signals (B), and statistical analysis (C). Data were normalized to the response of the 2.5 Hz/1.0 ml stimulation. Paired t test, *p < 0.05; n = 5/one-way ANOVA, F(2,12) = 17.78, *p < 0.05. D–F, Model II: the elicited BOLD patterns (D), corresponding time courses of BOLD signals (E), and statistical analysis (F). Data were normalized to the response of 1.5 Hz/2.0 ml stimulation. Paired t test, *p < 0.05; n = 5/one-way ANOVA, F(2,12) = 14.15, *p < 0.05. G–I, Model III: the elicited BOLD patterns (G), corresponding time courses of BOLD signals (H), and statistical analysis (I). Data were normalized to the response of 2.5 Hz/1.0 ml stimulation. Paired t test, N.S, p > 0.5; n = 6/one-way ANOVA, F(2,15) = 0.042, N.S, p > 0.5. Error bar, SE.

