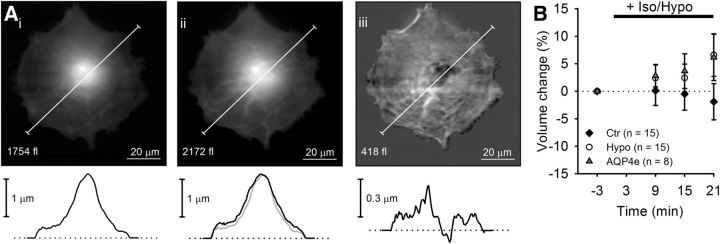
Figure 5.
Prolonged hypoosmotic stimulation induces a slow increase in astrocyte volume monitored by AFM. Ai, Aii, Linearized height images of an astrocyte before (Ai) and 21 min after (Aii) the application of a hypotonic solution and corresponding height profiles. Aiii, A subtraction image (hypotonic − control) indicating cell swelling. B, Time-dependent changes in the total cell volume of astrocytes treated in isoosomotic solution (controls, black diamonds) or in hypotonic solution (empty circles), and astrocytes transfected with AQP4e and treated with hypotonic milieu (gray triangles). Numbers in the brackets represent the number of cells analyzed. One-way ANOVA with the Holm–Sidak post hoc test versus control was used for statistical comparison.

