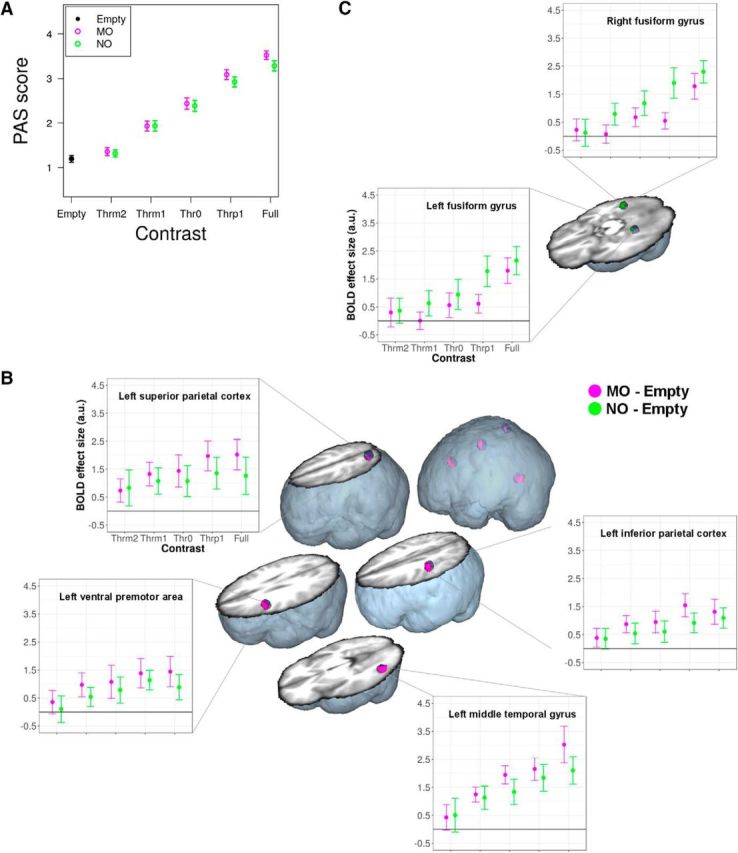
Figure 2.

BOLD as a function of contrast. A, Average (n = 24) behavioral PAS ratings for MO and NO as a function of image contrast level. Vertical bars indicate 95% confidence intervals. B, Subliminal MO-specific brain activation in the OAS and in the left lateral middle temporal gyrus as a function of contrast (n = 24). Brain activations (corrected p < 0.05; purple) are overlaid on the small volumes-of-interest (blue spheres) and displayed on a volumetric rendering of the average anatomical image of all participants. Dot-plots indicate average BOLD responses across all significant voxels in the activation cluster. Vertical bars indicate 95% confidence intervals. C, Subliminal NO-specific brain activation (green; all other conventions are identical to B) as a function of contrast (n = 24, corrected p < 0.05), with significant effects in the left and right fusiform gyri.
