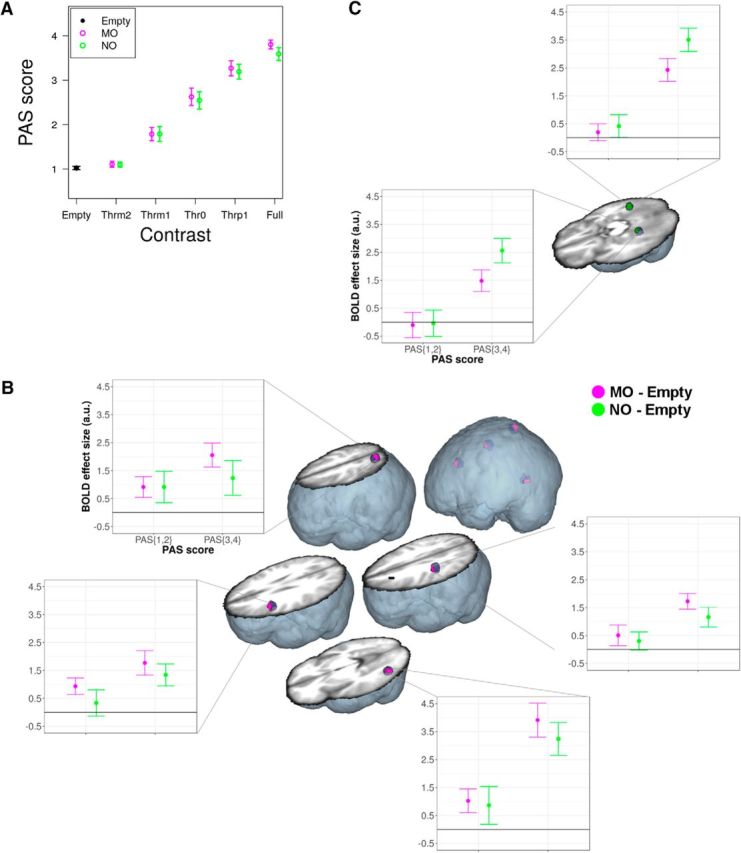
Figure 4.

BOLD as a function of PAS. All conventions are identical to Figure 2. A, Average (n = 12) behavioral PAS ratings for MO and NO as a function of image contrast level in the subsample of 12 subjects included in the BOLD analysis as a function of PAS. Vertical bars indicate 95% confidence intervals. We found that contrast (χ(4)2 = 248.51, p < 2.2 × 10⁻¹⁶), and not manipulability (χ(1)2 = 0.15, p = 0.699), was a significant predictor of PAS ratings. The Contrast × Manipulability interaction was not significant (χ(4)2 = 0.46, p = 0.977). B, Subliminal MO-specific brain activation in the OAS and in the left lateral middle temporal gyrus as a function of PAS ratings (n = 12, corrected p < 0.05). PAS(1, 2) = level of the PAS score factor corresponding to CFS trials in which the reported PAS score was either 1 or 2; PAS(3,4) = level for trials with reported PAS score 3 or 4. C, Subliminal NO-specific brain activation as a function of PAS ratings (n = 12, corrected p < 0.05), with significant effects in the left and right fusiform gyri.
