Figure 5.
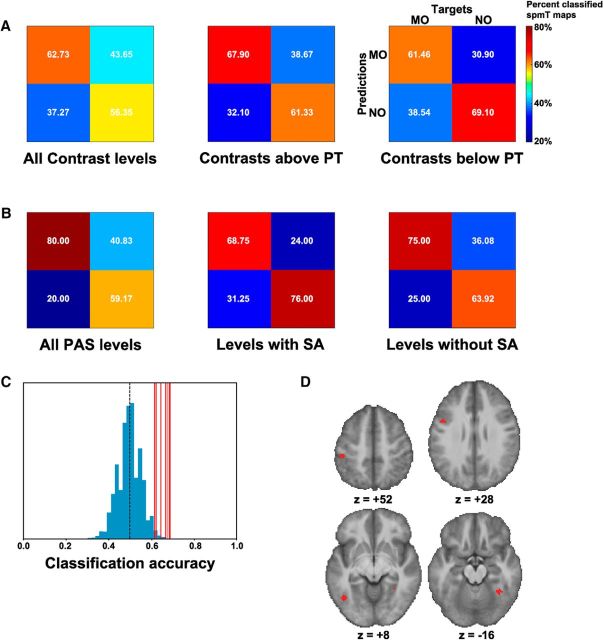
Multivariate pattern analysis. A, MVPA as a function of contrast: confusion matrices reporting the means of the classified MO/NO spmT maps across the significant (p < 0.005, against 1000 permutations) searchlight spheres, expressed as percentage values, for the analysis of all contrast levels (left), all levels above perceptual threshold (middle), and all levels below perceptual threshold (right; with fully labeled matrix structure, which is the same for all matrices in A and B). B, MVPA as a function of PAS ratings: map classification means across the significant searchlight spheres, expressed as percentage values, for the analysis of all PAS levels (left), just the PAS levels indicating presence of subjective awareness (middle), and just the PAS levels indicating absence of subjective awareness (right). C, MVPA as a function of contrast, all levels below perceptual threshold: actual classification accuracies for the significant searchlights (red lines), against the accuracy distribution of 1000 random permutations (blue histogram). The black dashed line indicates the chance classification level. D, MVPA as a function of contrast, all levels below perceptual threshold: anatomical location of the significant searchlights, in the ventral premotor cortex, inferior parietal cortex, lateral middle temporal gyrus, and right fusiform gyrus (Table 4).

