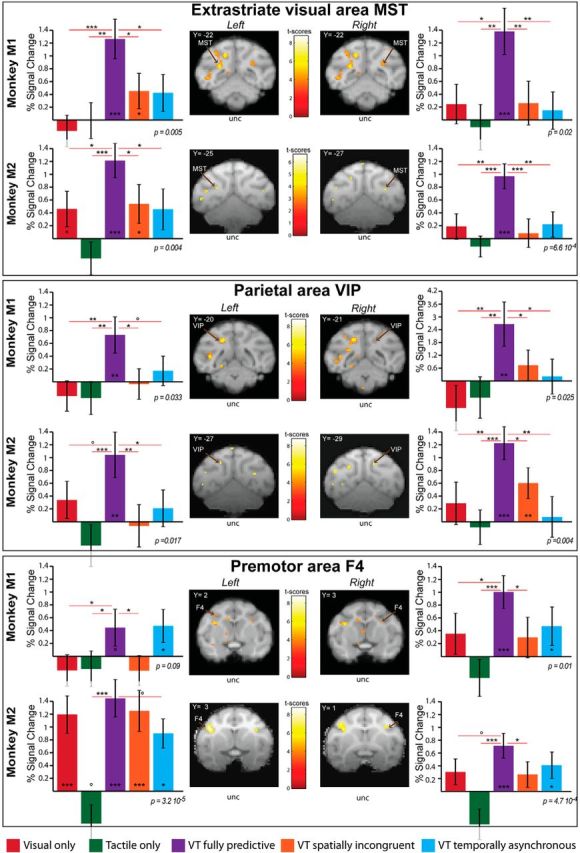
Figure 6.

Impact prediction activates a parietofrontal network. Histograms represent the percentage signal change for visual (red), tactile (green), VT fully predictive (purple), VT spatially incongruent (orange) and VT temporally asynchronous (blue) conditions for Monkeys 1 and 2, for selected ROIs in the extrastriate cortex (MST), the parietal cortex (area VIP) and the premotor cortex (area F4). As in Figure 5, the ROIs are selected on a VT predictive versus fixation contrast using half of the available runs (p < 0.001, uncorrected level), and the extraction of the PSC is performed onto the remaining independent half of the runs. For each ROI, block effect is assessed by a repeated measure one-way ANOVA; significance of PSCs difference with respect to baseline and among themselves is assessed using paired t tests. *p < 0.05, **p < 0.01, ***p < 0.001; °0.05 < p < 0.07.
