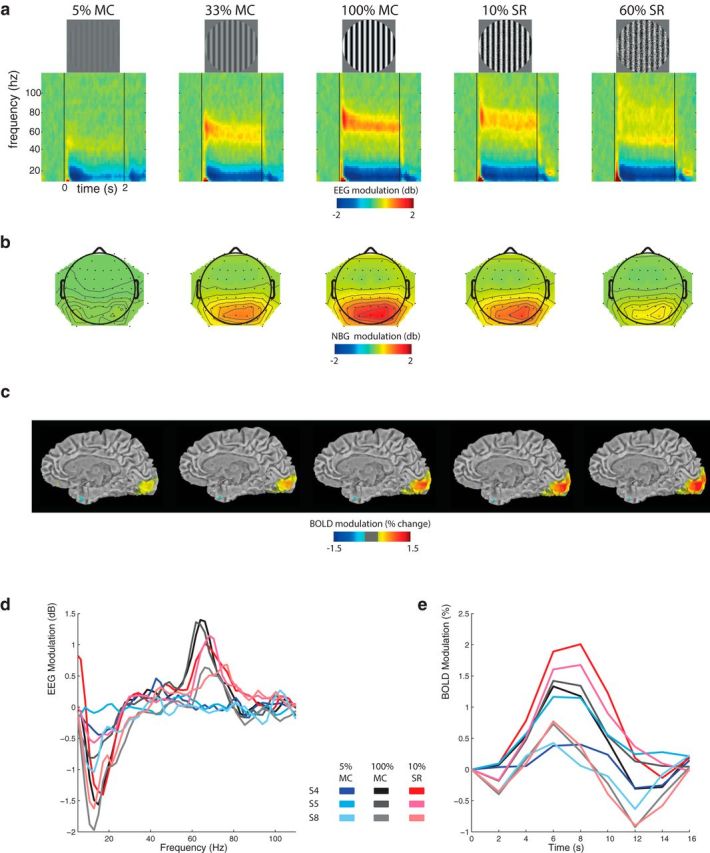
Figure 1.

Qualitative overview of EEG and BOLD responses to visual stimulation. Five visual stimulus types: from left to right, 5% MC, 33% MC, 100% MC, 10% SR, and 60% SR and corresponding group-average (n = 22) of the (a) EEG time frequency decomposition, (b) NBG (60–70 Hz) scalp topography, and (c) BOLD response maps overlaid on a T1-weighted anatomical template (for visual purposes only, values <±0.5% are masked out). Both NBG and BOLD tend to increase with MC but become dissociated with SR. Examples of stimulus-evoked (d) EEG and (e) V1 BOLD signals from 3 subjects and stimulus conditions. The same trend is observed for both “strong” (Subjects S4 and S5) and “weak” (Subject S8) NBG responders.
