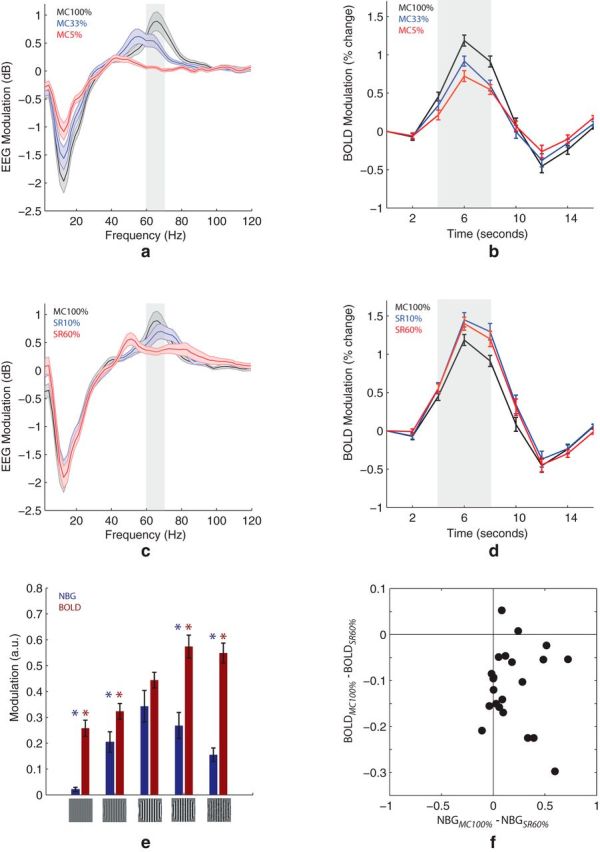
Figure 2.

Quantitative analysis of EEG and BOLD responses to MC and SR. Group-average (n = 22) EEG and BOLD modulation for different MC (a, b) and SR (c, d) levels. a, c, Highlighted area represents the represents the frequency range (60–70 Hz) where EEG modulation is statistically significant (p < 0.05, FDR) in both MC and SR conditions. e, Summary of NBG and BOLD response magnitude (averaged within highlighted areas in a–d across all stimulus types). *Significant difference (p < 0.01) relative to 100% MC. Error bars indicate SEM. f, Each dot indicates the mean NBG and BOLD modulation at SR 60% (relative to MC 100%) from a single participant (22 subjects in total). Subject-to-subject variations in NBG and BOLD were not significantly correlated (p > 0.05).
