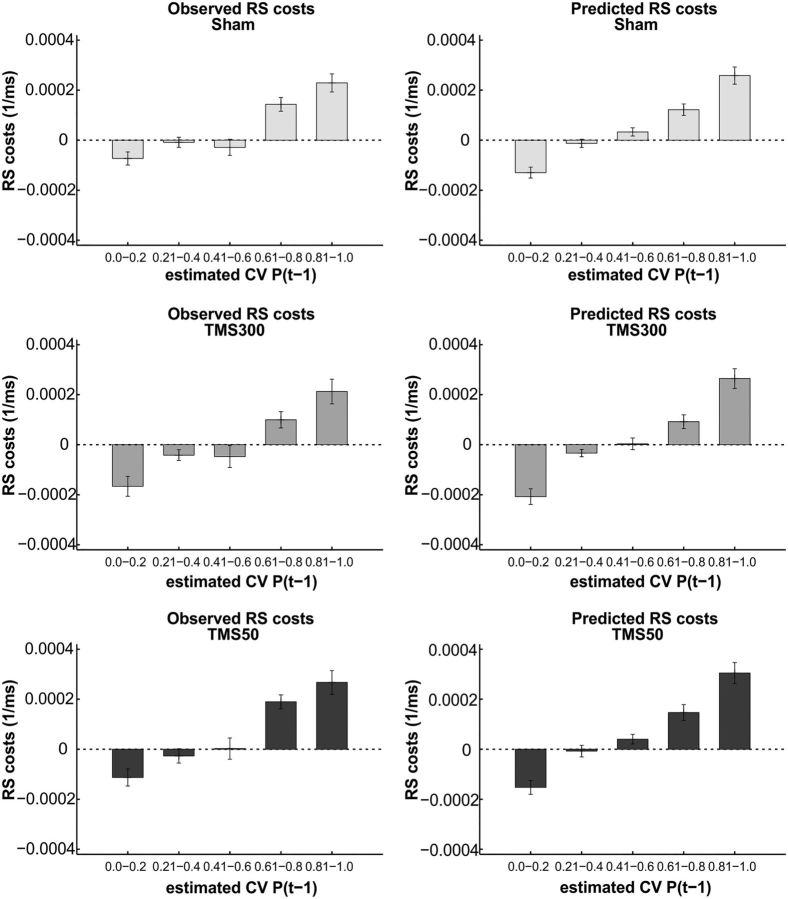
Figure 3.
Observed and predicted pattern of RS costs from the learning model. RS costs were calculated by subtracting RSs of invalid trials from valid trials and are shown in relation to the participants' estimated probability that the cue will be valid in an upcoming trial P(t−1), binned in intervals of 0.2. As expected, RS costs increased with increased subjective %CV, and the pattern of observed RS costs matched the RS costs predicted by the model on the basis of individual values for α, P(0), ζ1_valid, ζ1_invalid, and ζ2 in the different blocks and sessions. Error bars indicate SEM.

