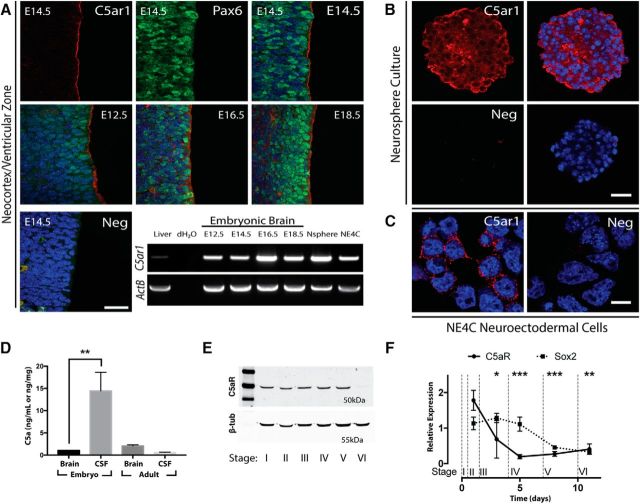
Figure 1.
Localization of C5aR1 and ligands. A, C5aR1 (red) is expressed in the developing neocortex at the apical surface of the ventricular zone at E14.5 (top row). Shown is counterstain with Pax6 (green) and DAPI (blue). Scale bar, 50 μm. Merged images of the ventricular zone at E12.5, E16.5, and E18.5 are shown in the second row. RT-PCR demonstrates C5aR1 expression in embryonic brain tissue, neurosphere, and NE-4C culture. B, C5aR1 expression (red) within sectioned neurosphere. Neg, Secondary-only negative control. Scale bar, 50 μm. C, C5aR1 expression (red) on NE-4C cells grown in monolayer. Neg, Secondary-only negative control. Scale bar, 20 μm. D, Embryonic CSF contains mC5a at significantly greater concentrations than brain tissue or maternal CSF. E, C5aR1 is detected within NE-4C cultures by Western blot at the predicted molecular weight (50 kDa) and decreases at stage VI of differentiation. Stages indicate morphologically distinct progression of NE-4C differentiation (see Materials and Methods). F, Expression of C5aR1 mRNA decreases with differentiation of NE-4C cells. Progenitor marker Sox2 is assayed as a comparison. *p ≤ 0.05, **p ≤ 0.01, ***p ≤ 0.001.

