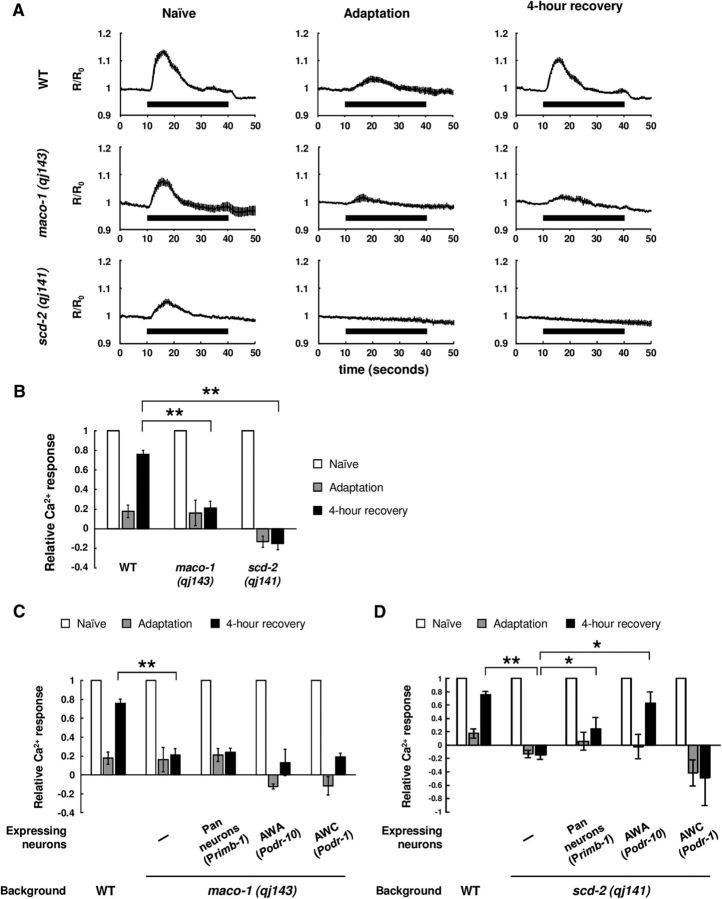
Figure 5.
Ca2+ responses of AWA sensory neurons after adaptation and recovery. A, Averaged traces of Ca2+ response in AWAs in naive, diacetyl-adapted, and 4-h-recovered animals (n ≥ 8). Timing of the diacetyl stimulation is shown as black bars. R represents the YFP/CFP ratio, and R0 represents the averaged ratio 30 s before diacetyl stimulation. B, Quantification of Ca2+ responses of wild-type, maco-1 (qj143), and scd-2 (qj141) animals (n ≥ 8, 2-way ANOVA, Fstrain(2,114) = 88.7, p < 0.001). Data were normalized to the averages in the naive animals. C, Transgenic rescue of maco-1 (qj143) mutant animals by expressing wild-type gene under a pan-neuronal promoter (n ≥ 5, 2-way ANOVA, Fstrain(4,148) = 88.2, p < 0.001). D, Transgenic rescue of scd-2 (qj141) mutant animals by expressing wild-type gene under rimb-1 and odr-10 promoters (n ≥ 6, 2-way ANOVA, Fstrain(4,150) = 7.4, p < 0.001). *p < 0.05, **p < 0.01; post hoc t test with Bonferroni's correction (B–D). Error bars represent SEM.

