Figure 4.

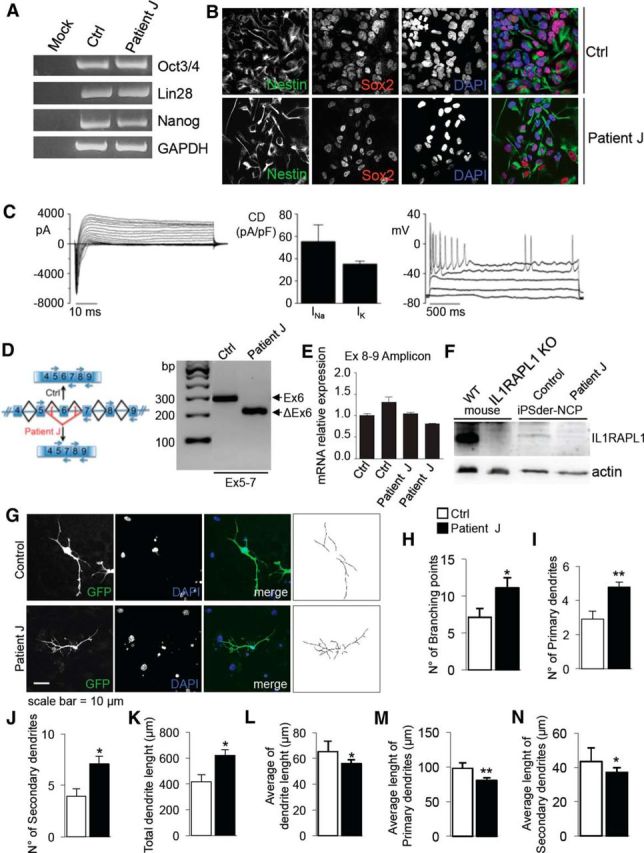
Dendritic arborization complexity is altered in iPS cells derived from patient carrying a mutation in IL1RAPL1 gene. A, B, Characterization of iPS cells (A) and neuronal precursors (B) from healthy donor and Patient J carrying mutation in IL1RAPL1 gene. C, Left, Total voltage-gated current traces recorded from a representative differentiated neuron by applying a depolarizing voltage step protocol from a holding potential of −70 mV. Seventy-seven percent (10 of 13) of the recorded neurons express Na+ and K+ currents. Bar graph (center) shows mean Na+ and K+ current densities measured at −20 and +20 mV, respectively. Right, Action potentials recorded from the same differentiated neuron in the left panel by injecting depolarizing currents of increasing amplitude from a resting potential of −70 mV. D, E, mRNA expression analysis of IL1RAPL1 gene in neural precursor derived from healthy donor and Patient J carrying the Δ exon 6 mutation in IL1RAPL1 gene shows that in Patient J, exon 6 is specifically deleted (D) but the total expression levels of the WT and mutated mRNA are similar (E). Data are shown as mean ± SEM of three independent experiments. F, Western blot analysis of neural precursor derived from healthy donor and Patient J carrying the Δ exon 6 mutation in IL1RAPL1 gene shows that the expression of IL1RAPL1 protein is absent in the neural precursor derived from Patient J; for comparison, the expression of IL1RAPL1 protein in brain extracts of WT and Il1rapl1-KO mice is shown in the two first lanes. G, Representative images of iPS cell-derived neurons from healthy donor and Patient J (III-2) and a schematization of their dendrites on the right. H–N, Analysis of the morphology of iPS cell-derived neurons from healthy donor and Patient J (15 neurons analyzed for each condition in 3 independent experiments). We evaluated the number of branching points (H), the number of primary (I) and secondary (J) dendrites, total (K) and average (L) dendrite length, the average length of primary (M) and secondary (N) dendrites. Data are shown as mean ± SEM. *p < 0.05, **p < 0.005 vs Ctrl, Student's t test.
