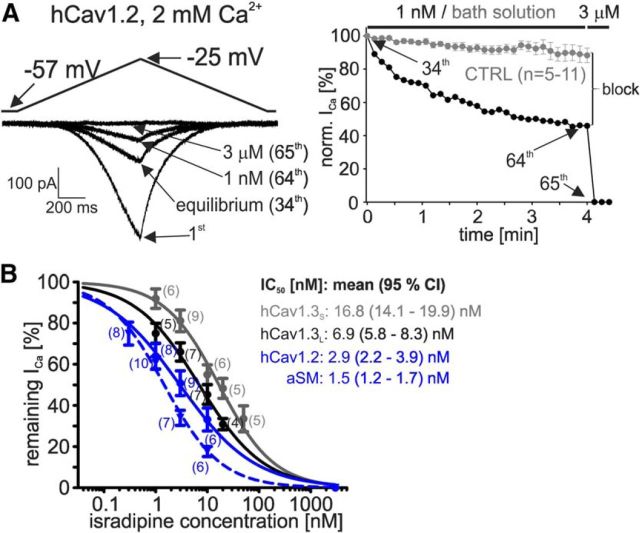
Figure 5.
ISR sensitivity of hCav1.2 steady-state ICa during simulated aSM tone and ISR concentration–response curves for SN DA and aSM LTCCs (2 mm Ca2+). hCav1.2 (blue; SN DA, solid line; aSM, dashed line), hCav1.3S (gray), and hCav1.3L (black) are shown. A, aSM activity mimicked by voltage ramps. Starting from an HP of −89 mV, voltage was ramped from −57 to −25 mV and back to −57 mV at 32 mV/s and with an intersweep interval of 8 s at −57 mV. When ICa became stable (“equilibrium”), cells were perfused with vehicle (control, CTRL) or different concentrations of ISR and subsequently ICa was completely blocked by 3 μm ISR. Right, Normalized current of the same recording illustrating inhibition by 1 nm with time (1 pulse/8 s). Last sweep before drug application (34th sweep, “equilibrium,” left) was set to 100% and the percentage of inhibition was calculated after subtracting current decay in control cells (gray; mean ± SEM) from ISR effects. B, Concentration–response curves for LTCC steady-state ICa inhibition by ISR during simulated SN DA neuron pacemaking (hCav1.3, hCav1.2) and during aSM-like activity (hCav1.2). Data were fitted to a sigmoidal dose–response equation with variable slope (Hill slopes: hCav1.3S, −0.81 ± 0.06; hCav1.3L, −0.70 ± 0.06; hCav1.2, −0.60 ± 0.09; hCav1.2 aSM, −0.79 ± 0.06). Statistical significance was determined using the extra sum-of-squares F test (Hill slopes, p = 0.797; IC50 values, p < 0.0001). Significance level was set to p < 0.05.

