
Figure 7.
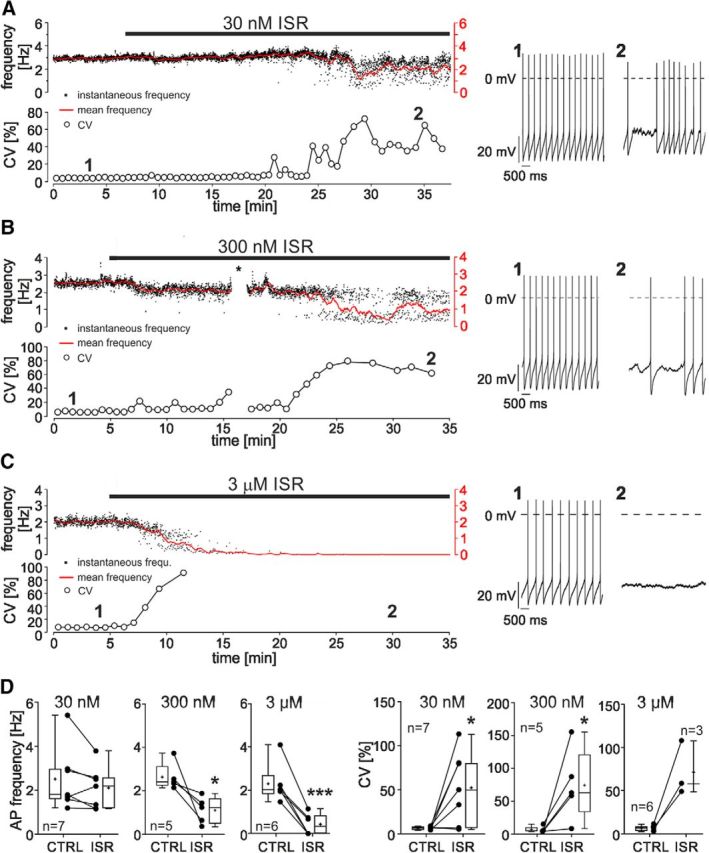
ISR effects on pacemaking in SN DA neurons recorded in adult mouse brain slices. A–C, Top, ISR effect on instantaneous AP frequency (black dots, calculated from current ISI), mean AP frequency (red line, bin width 30 s), and CV (from 100 ISI) before and during application of the indicated concentrations of ISR. Original traces from the recordings at the time points indicated by numbers are shown on the right. D, Summary box plots for spontaneous frequency and CV (mean of 2 min) under control conditions (CTRL) and 30 min after application of the indicated ISR concentrations (ISR). The number of neurons is given in the panels. After exposure to 3 μm ISR, three of six neurons stopped firing spontaneous APs and could not be included in the CV analysis. Statistical significance was determined using paired t test: ***p < 0.001; **p < 0.01; *p < 0.05. The asterisk in B shows a brief interruption of data acquisition.