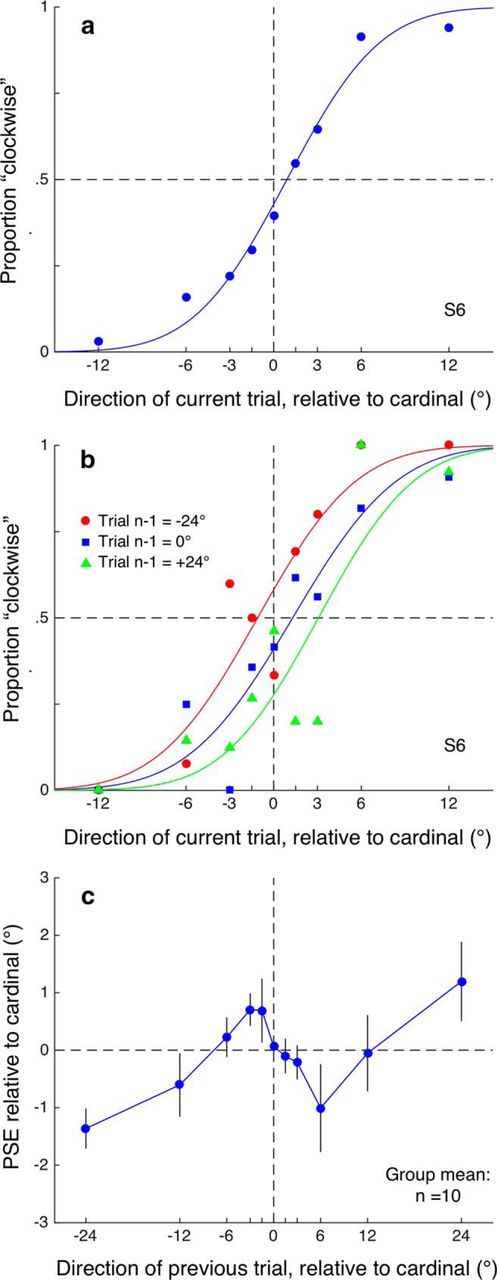
Figure 2.

Results from Experiment 1. a, Data from a single participant in Experiment 1 plotting a psychometric function obtained by pooling all trials by direction and fitting a cumulative Gaussian to the data. This is the classical approach to analyzing perceptual discrimination data and the point of subjective equality PSE (given by parameter μ) and function width (σ) are the parameters of interest. Here, the observer's perceptual bias is very small (error from true cardinal is only 0.90°) and the discrimination threshold (5.03°) shows good precision for motion discrimination. b, Intertrial analysis. Instead of pooling all responses into a single function, each response is binned into one of 11 categories depending on the direction presented on the preceding trial. Separate psychometric functions are then fitted for each of the 11 preceding directions. As shown for one observer for several levels of preceding direction (−24°, 0°, and 24°), the horizontal position of the psychometric functions varied systematically with the preceding trial's direction, indicating a sequential dependency. This dependency, typical of all observers, would tend to broaden discrimination functions calculated in the traditional manner by conflating laterally shifted functions. In all subsequent plots, only the PSEs are shown, plotted as a function of the preceding trial's direction. c, Group mean data from Experiment 1 plotting the PSE (indicating the subjective cardinal, the direction where motions are equally judged leftward or rightward of the cardinal) as a function of the preceding trial's direction. Error bars indicate ±1 SEM.
