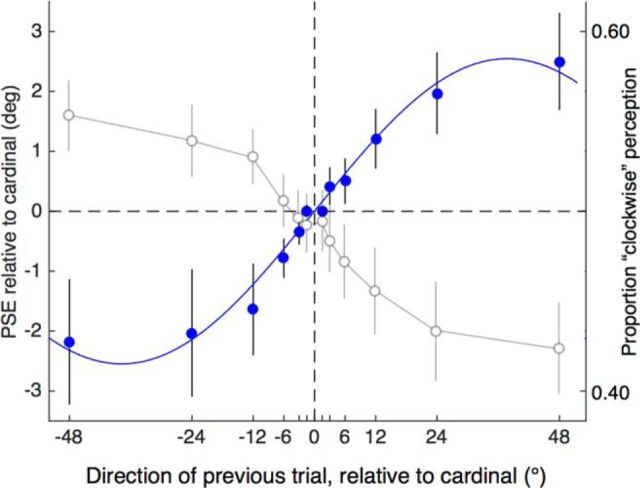
Figure 3.
Group mean data from Experiment 2. Filled symbols plot the PSE for direction discrimination as a function of the preceding trial's motion direction. These data were obtained with translating dots that alternated in direction between up and down, canceling motion adaptation between trials but not orientation adaptation. The results show a strong positive relationship for between PSE and the preceding trial's direction attributable to the orientation component. The continuous line shows the best-fitting sinusoidal function with the following parameters: amplitude = 2.55°, peak = 37.8°, and r2 = 0.99. Open symbols relate to the second y-axis and show mean proportion of “perceived clockwise” responses and thus reflect the observers' perception. Each data point is the mean of all points on the psychometric function that was calculated for each preceding direction. The proportion of clockwise perception and PSE location exhibit an inverse relationship, illustrating that the positive PSE function is a negative one in perceptual terms: a repulsion effect or negative dependency. Error bars indicate ±1 SEM.

