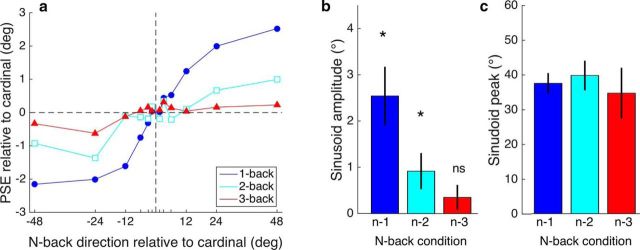
Figure 4.
Group mean data from Experiment 2. a, PSE for direction discrimination as a function of the n-back trial's motion direction. The PSE shifts for the one-back direction are compared with PSEs for two-back and three-back directions. b, Data for each n-back level in a were fitted with a sinusoid function (as in Fig. 3). The amplitudes of the best-fitting functions show a strong decline to near-zero amplitude at the three-back level. Asterisks show a significant difference from zero on a one-tailed t test (α = 0.05). c, Peak of the best-fitting sinusoid is very similar across the three n-back levels. Error bars indicate ±1 SE of measurement.

