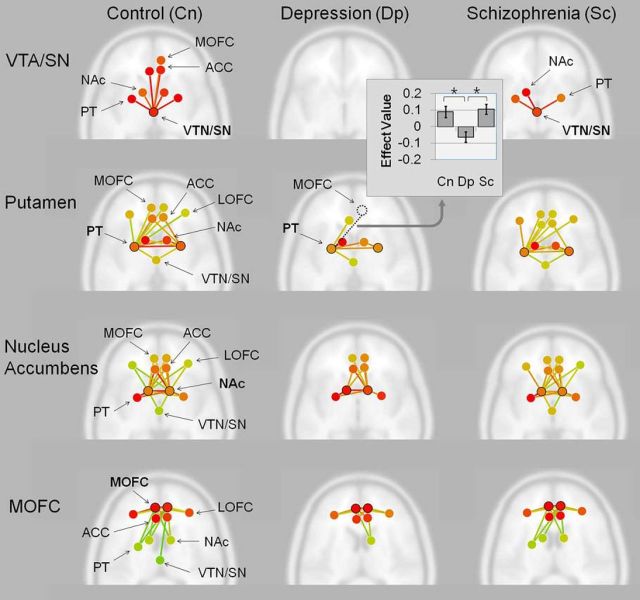
Figure 6.
Within-group ROI-to-ROI resting-state functional connectivity analyses results and bar graph of between-group difference in functional connectivity. ROIs include the VTA/SN, NAc, putamen (PT), ACC, and medial and lateral orbitofrontal cortex (MOFC, LOFC). Seed regions related to effort and reward value in the VTA/SN, PT, and the MOFC and effort value related seed regions in the NAc were selected for analyses. Axial view of the brain with ROIs and their functional connectivities are shown with red-to-yellow green color lines representing greater-to-less connectivity strengths at a significant FDR-corrected p < 0.05. *FDR-p < 0.05.

