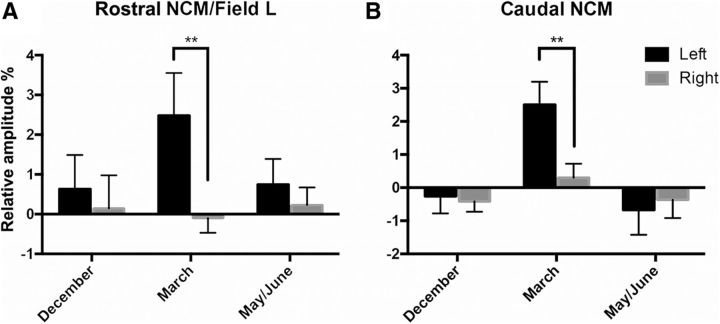
Figure 5.
Lateralization of VOR effects. Relative amplitudes (percentage) of differential (control − VOR) responses to all auditory stimuli (INDIV, SPEC, and PT) pooled in left (black bars) and right (gray bars) rostral (A) and caudal (B) NCM. Positive values indicate that the region of interest was more activated during control than during VOR treatment and vice versa. The error bars correspond to SEMs across subjects. Stars indicate that the difference between left and right NCM clusters is significant by post hoc tests (**p < 0.01).

