Figure 2.
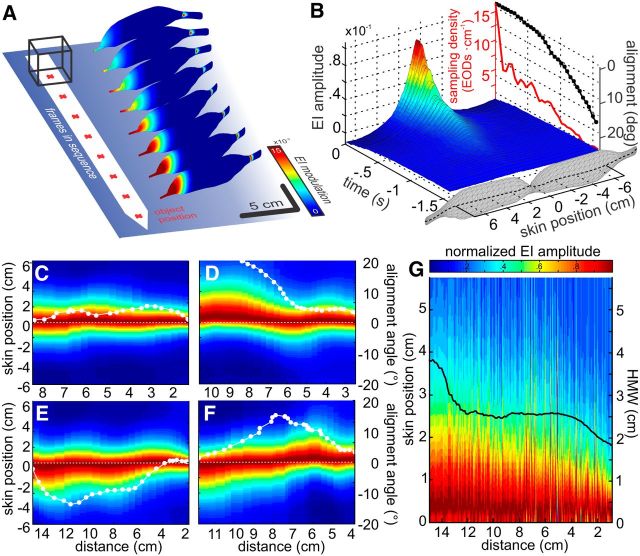
Spatiotemporal electrosensory flow during naturalistic behavior. A, Electric images for every second frame of the final 16 EODs of an individual approach. Images are shown with a frame-by-frame lateral offset from the object. Red crosshairs represent object center of mass. B, Spatiotemporal representation of the EI (as calculated in Eq. 2) for the sequence shown in A. The spatial domain is represented on the x-axis. Skin position is calculated along a sampling equator along the fish body that is indicated by the black dotted line in the fish schemes: positive x-values indicate positions on the left side of the body, whereas negative values indicate positions on the right side. The discontinuous temporal domain is shown on the y-axis. Sampling density (red line) increased, whereas the alignment angle between body and object decreased steadily (black line). This was a consistent pattern (Fig. 1D, E). C–F, EI sequences plotted as a function of object distance for four approaches. y-axis indicates the skin position of the EI along the sampling equator (see B). Individual electric images along this equator were normalized to their peak value and then plotted as a function of object-distance (x-axes). White lines indicate the body-object alignment for the individual sequences (see right-hand y-axes). White dots indicate where an EOD was emitted. G, Normalized and stacked EIs from all EODs (n = 2388) emitted during all approaches toward the 8 cm3 cube. Each normalized EI was arranged such that its peak is located on the right side of the animals' body, the side being shown here. Following this, EIs were ordered as a function of distance to the cube, leading to a cumulative figure showing how the sensory input changed with nearness to the cube. The peaks of electric images became more focused on the head (skin position = 0) with nearness to the cube; likewise, the average half-maximum width (black line) decreased. This illustrates a gradual focusing of the EI on the head region. The trajectories used for visualization in this figure are marked with their respective panel letter in Figure 1A.

