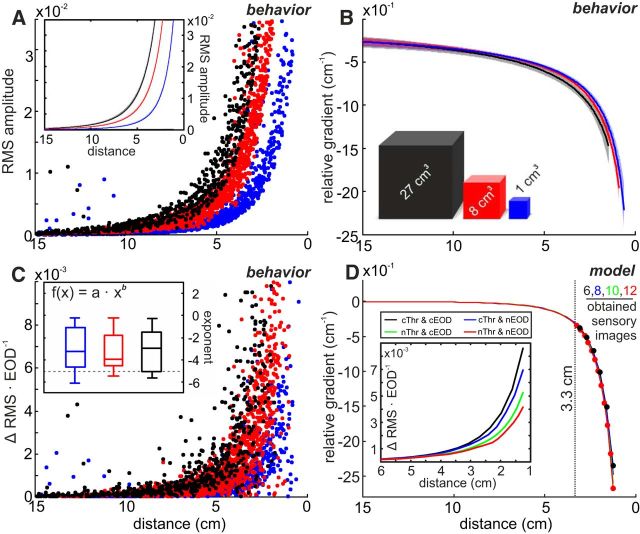
Figure 4.
Electrosensory flow allows distance estimation. A, Electric image amplitude (RMS, see Eq. 3) as a function of distance for the three different object sizes (0 = center of objects). The EI amplitude increased following a power law with an exponent of −4. Inset, Power-law fits to the data with CIs. B, Relative gradient (fit with CIs) as a function of distance. Data of individual sequences were inseparable between cube sizes (Kruskal–Wallis test; scaling: χ2 = 1.0, F = 0.5, df = 2, p = 0.49; exponent: χ2 = 0.3, F = 0.2, df = 2, p = 0.85), indicating that the relative gradient provides a size invariant estimate of the distance to objects. C, Electrosensory flow calculated for the behavioral data, plotted as a function of distance to the object at the present EOD. The flow is calculated as the absolute change of the EI RMS amplitude between successive EODs. Inset, Distribution of the power-law exponents obtained from the fits of the electrosensory flow of individual approach sequences. For the great majority of sequences (87%), exponents were >−5 (i.e., first derivative of field, horizontal dashed line), indicating that the patterned behavior actively reduces the magnitude of the electrosensory flow. The distributions of fit parameters were inseparable between cube sizes (Kruskal–Wallis test; shift: χ2 = 1.8, F = 0.9, df = 2, p = 0.41; exponent: χ2 = 0.2, F = 0.1, df = 2, p = 0.93). D, Effect of different modeled sampling behaviors on the RG and electrosensory flow. Different sampling results in different slopes of the electrosensory flow (inset), whereas the relative gradient is not affected (main panel). However, the number of EIs obtained is doubled from constant to naturalistic behavior. cThr, Constant thrust; nThr, naturalistic thrust; cEOD, constant EOD frequency; nEOD, naturalistic EOD frequency. For naturalistic values, we used the population means (Fig. 1B, C).

