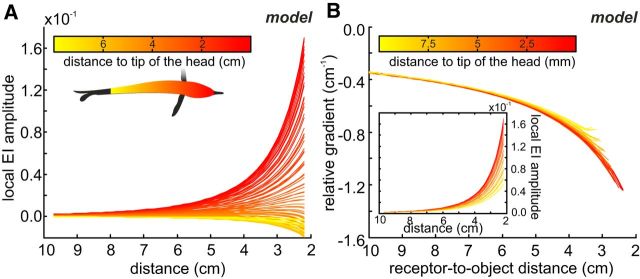
Figure 6.
Body position invariance of the relative gradient metric. A, Local EI amplitude (see Eq. 2) at distinct body positions as a function of object distance. The data were obtained by simulating a straight approach to a metal cube (8 cm3) and fitting power-law functions to the EI amplitudes obtained at different positions along the sampling equator (see color code). Depending on the position on the body, EI amplitude either increased (in the head region and in close vicinity; red colors) or decreased (lateral body regions; yellow colors) with increasing proximity to the object. B, Relative gradient calculated for a subset of the data shown in A (inset). Thrust was assumed to be constant in our simulation, and the distance to the cube was separately calculated for each position on the skin. The strong overlap of the data shows that this metric is only weakly influenced by the body position. For a comparison of the RG and SAR for distance estimation, see Figure 7.

