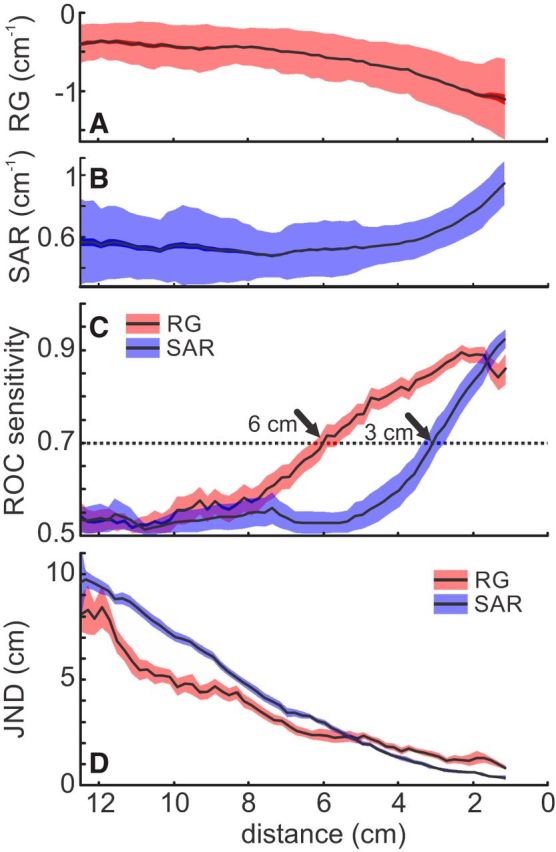
Figure 7.

Distance estimation based on electrosensory flow versus single EI cues (SAR). A, RG as a function of object distance. B, SAR as a function of object distance. A, B, Data indicate standard deviation (shaded area), SEM (solid area), and the arithmetic mean (black line) of all approaches pooled. C, Object detection for RG (red) and SAR (blue). Data were calculated by comparing a reference distribution of the behavioral values at high distance (10.5 cm) to all closer distributions, taking the area under the ROC curve as a measure of sensitivity. A threshold of 70% was defined as detection, which is achieved at 6 cm distance for the RG and at 3 cm distance for the SAR, showing a higher sensitivity for the RG. D, Distance discriminability of the two measures was quantified by the JND. The JND was lower for the RG compared with the SAR for all distances >5 cm, indicating a better distance resolution when relying on the RG at high distances.
