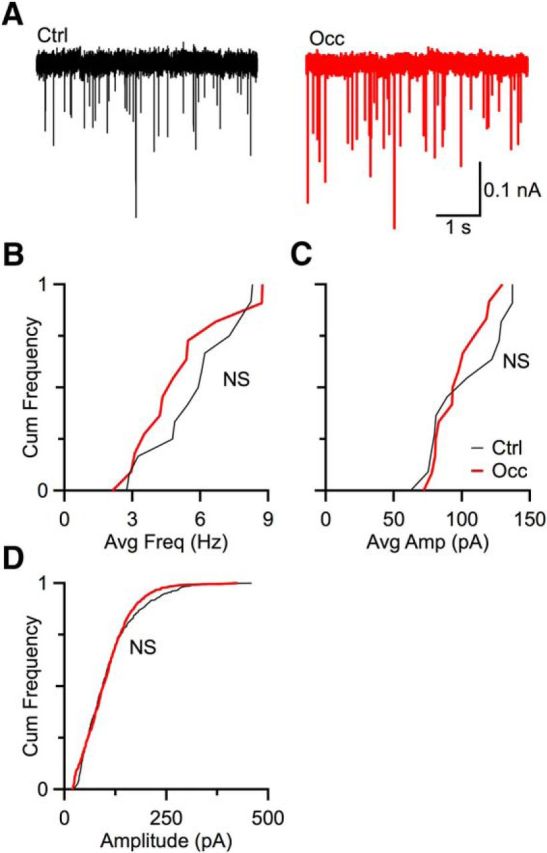
Figure 3.

Q remained the same after occlusion. A, Representative spontaneous mEPSCs from a control mouse (left) and an occluded mouse (right). Cumulative frequency plots of average mEPSC frequency (B) and amplitude (C) from mice under control (13 cells) and occlusion (12 cells) condition. Occlusion had no significant effect on mEPSC amplitude (p > 0.1, Kolmogorov–Smirnov test) or frequency (p > 0.5, Kolmogorov–Smirnov test) of mEPSC. D, Cumulative frequency plots of 100 events total per cell under control (6 cells) and occlusion (8 cells) conditions. No significant difference was observed between control and occluded BCs (p > 0.1, Kolmogorov–Smirnov test).
