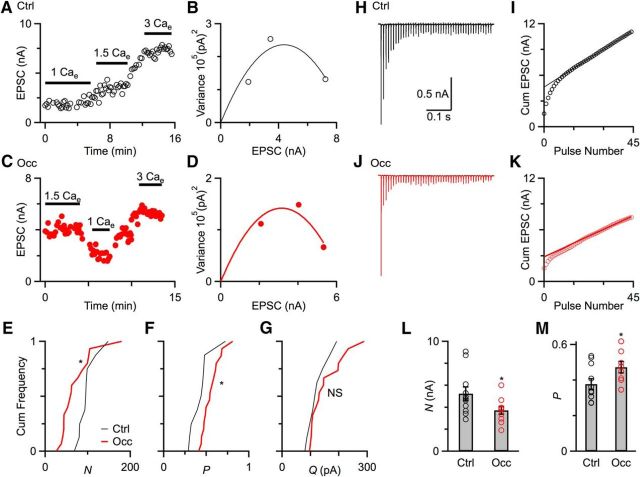
Figure 4.
Quantification of Pr, N, and Q. A, C, Example experiments showing effects of different Cae on EPSC amplitude over the course of the experiment from a control mouse (P22, A) and an occluded mouse (P23, C). Lines above the points indicate the data that are used for analysis. B, D, Markers indicate variance versus EPSC amplitude for each Cae concentration from experiments in A and C. Lines are fits to the equation σ2 = Qμ − (μ2/N), with N = 81 and Q = 108 in B, and N = 70 and Q = 90 in D. From these, Pr at 1.5 Cae is calculated to be 0.39 in B, and 0.64 in D. E–G, Cumulative frequency plot of N (E), Pr (F), and Q (G) from control mice (9 cells, black) and occluded mice (16 cells, red). After occlusion, N significantly decreased and Pr significantly increased (p < 0.05). Q showed no significant changes (p > 0.1). H, J, Representative long trains recordings in the presence of 1 mm kynurenate from a control mouse (H) and an occluded mouse (J) in response to stimulation of a single AN fiber (100 Hz, 45 pulses). I, K, EPSC amplitude is integrated, and a fit is extrapolated back from the last 20 cumulative EPSCs to the y-axis to estimate N (straight line). Pr is calculated by dividing the first EPSC by N. L, M, Quantification of N (L) and Pr (M) using the integration method from control mice (11 cells) and occluded mice (10 cells). Occluded endbulbs showed significantly smaller N (*p < 0.05) and higher Pr (*p < 0.05).

