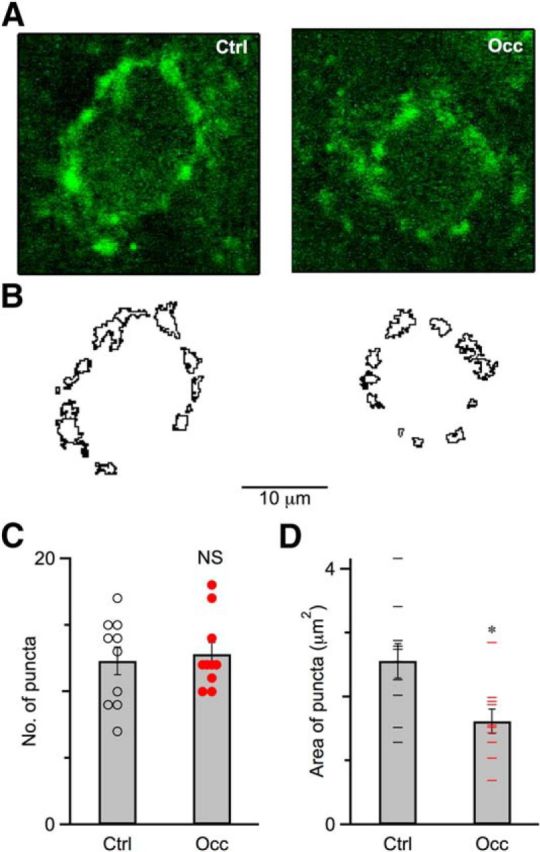
Figure 6.

Endbulb structure changed after occlusion. A, Single optical sections of a control (P31, left) mouse and an occluded (P31, right) mouse immunolabeled for VGLUT1 (green). Scale bar, 10 μm. B, Outlines of puncta for a control (left) and an occluded (right) mouse shown in A. C, Number of puncta surrounding BCs for control mice (10 cells) and occluded mice (10 cells). The number of puncta after occlusion was similar compared with control mice (p > 0.1). Error bars indicate mean ± SEM. Circles indicate number of puncta for individual BCs. D, Average area of puncta surrounding BCs for control mice (10 cells) and occluded mice (10 cells). Puncta significantly shrank after occlusion (p < 0.05). Error bars indicate mean ± SEM. Line marks indicate average area of puncta for individual BCs. *p < 0.05.
