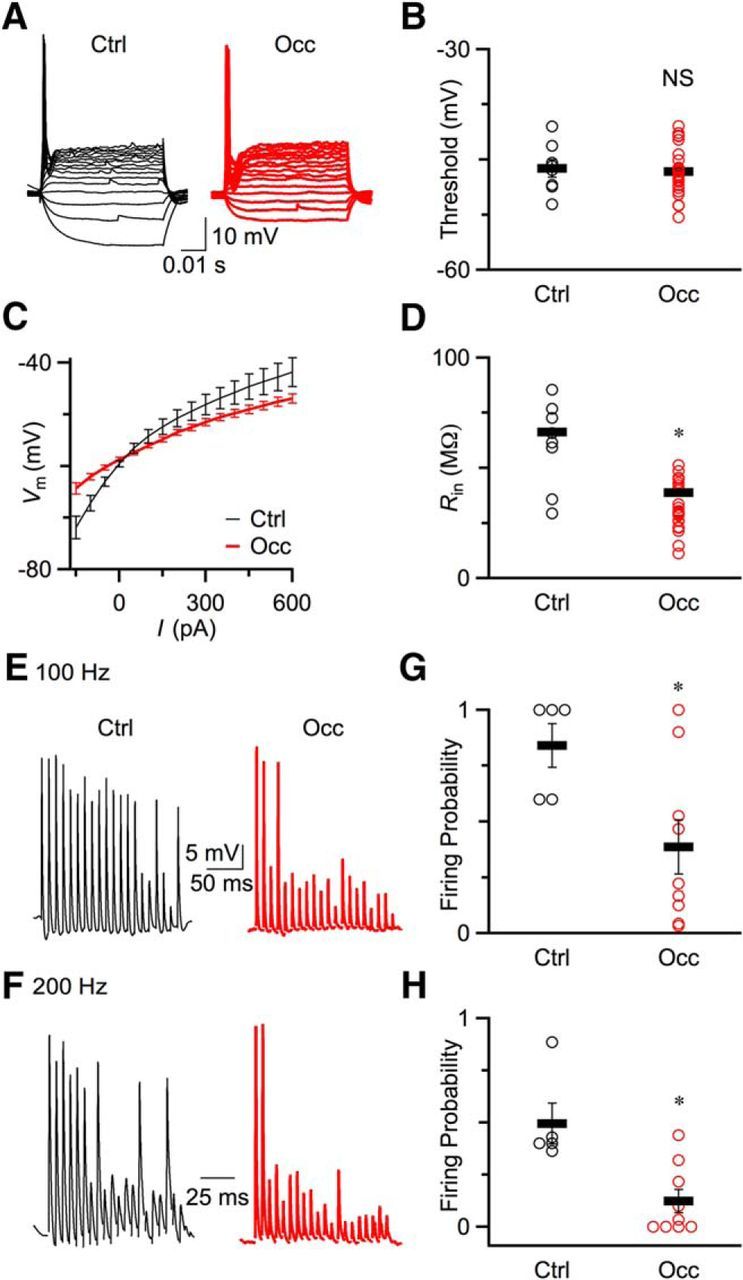
Figure 7.

BC excitability decreased after occlusion. A, Representative current-clamp traces recorded from a P20 control (left) mouse and a P23 occluded (right) mouse in response to current injection. B, Spike thresholds for control (8 cells) and occluded (24 cells) mice. Open circles represent raw data. Line markers indicate average results for control and occlusion. There were no significant changes in threshold (p > 0.5). C, Average plots of voltage versus injected current from control (8 cells) and occluded (24 cells) mice. D, Input resistances (Rin) at −60 mV for control and occluded mice. Rin significantly decreased after occlusion (p < 0.05). Line markers indicate mean ± SEM. Open circles represent individual data points. E, F, Example traces of current-clamp recordings of control BCs (left) and occluded BCs (right) in response to fiber stimulation at 100 Hz (E) and 200 Hz (F). Strip chart plots of firing probability for both 100 Hz (G) and 200 Hz (H). Firing probability was calculated during the last 10 stimuli during the trains. Spike fidelity decreased significantly after occlusion (*p < 0.05).
