Figure 2.

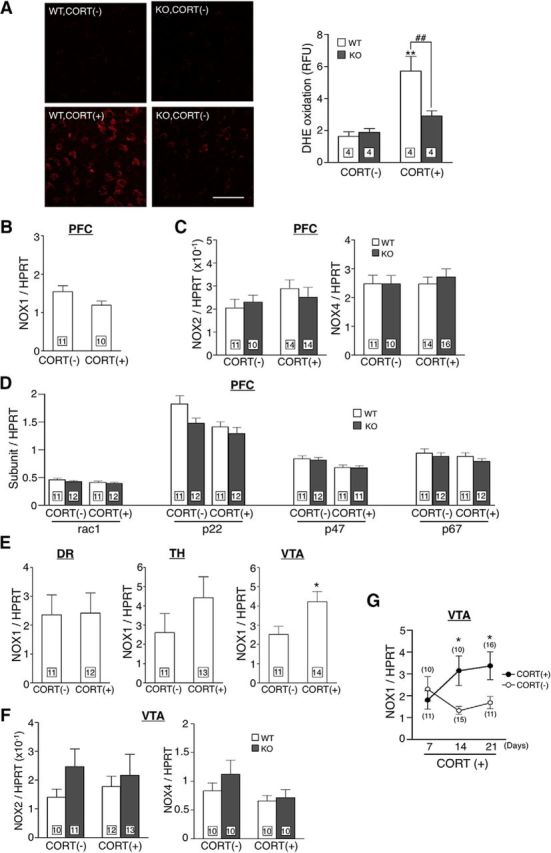
CORT increased ROS production and upregulated NOX1 in different brain regions. A, ROS production in PFC assessed by DHE fluorescence following 21 d of CORT administration. Left panels demonstrate representative photomicrographs of the fluorescence of DHE oxidation in PFC. Scale bar, 50 μm. The right panel demonstrates quantitative analysis of fluorescence in PFC. **p < 0.01 compared with WT/CORT(−) and ##p < 0.01. B, NOX1 mRNA levels in PFC following CORT administration (t(19) = 1.187, p = 0.166 by unpaired t test). C, Levels of NOX2 and NOX4 mRNAs in PFC of mice following CORT administration. D, The mRNA levels of other subunits of NADPH oxidase in PFC of mice following CORT administration. E, NOX1 mRNA levels in various brain regions of mice following CORT administration (dorsal raphe: t(22) = 0.066, p = 0.948; thalamus: t(21) = 1.212, p = 0.239; ventral tegmental area: t(17) = 2.545, *p < 0.05 compared with CORT(−) by unpaired t test). DR, Dorsal raphe; TH, thalamus. F, Levels of NOX2 and NOX4 mRNAs in VTA of mice following CORT administration. G, Time dependency of NOX1 mRNA expression in VTA. *p < 0.05 compared with WT/CORT(−).
