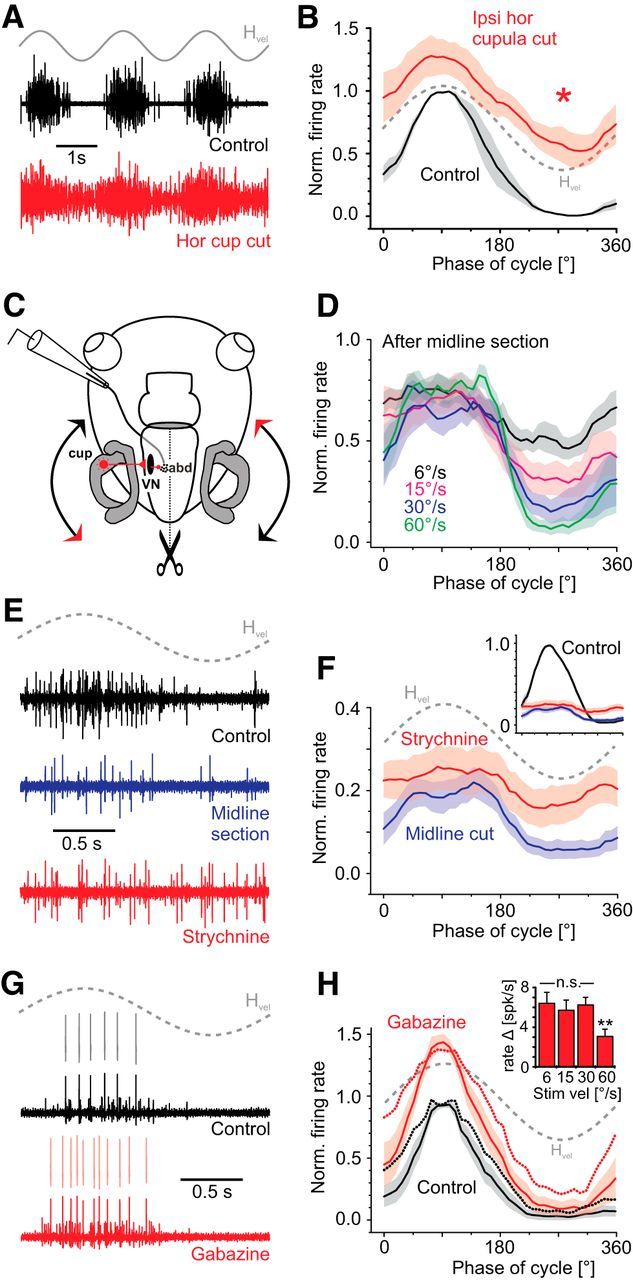
Figure 7.

Inhibitory neurotransmitter profile of abducens motor units. A, B, Representative example of a multiunit abducens nerve discharge over multiple rotation cycles (A) and average responses (B) over a single cycle (n = 3, ±SEM, shaded areas) before (black) and after surgical removal of the ipsilateral horizontal (hor) canal cupula (red). C, Schematic of a semi-intact preparation depicting the recording and stimulation paradigm, ipsilateral neuronal VOR connections and the removal of crossed excitatory vestibular inputs to abducens motoneurons by midline section (dotted line). D, Inhibitory modulation of average multiunit abducens nerve responses over a single motion cycle (n = 6, ±SEM, shaded areas) at 0.5 Hz and different stimulus velocities of head rotation after midline section. E, F, Representative example (E) and average responses (F) over a single motion cycle (n = 6, ±SEM, shaded areas) of the multiunit abducens nerve discharge before (control, black) after midline section (blue) and subsequent focal strychnine (10 μm) injection into the respective abducens nucleus (red). For comparison, average control responses over a single rotation cycle in the intact preparation are indicated in the inset in F. G, H, Representative example (G) and average responses (H) over a single motion cycle (n = 7 single units, ±SEM, shaded areas) of isolated single units before (black) and after focal injection of gabazine (10 μm) into the respective abducens nucleus. Dotted lines in H represent average responses of spontaneously active units (three of seven). The bar chart in the inset in H shows the average increase in firing rate of all single units (n = 7, ±SEM) at different peak stimulus velocities (at 0.5 Hz). abd, Abducens; cup, cupula; VN, vestibular nucleus. Gray (dashed) sine waves in A, B, and E–H indicate head motion stimulus velocity (Hvel).
