Figure 2.
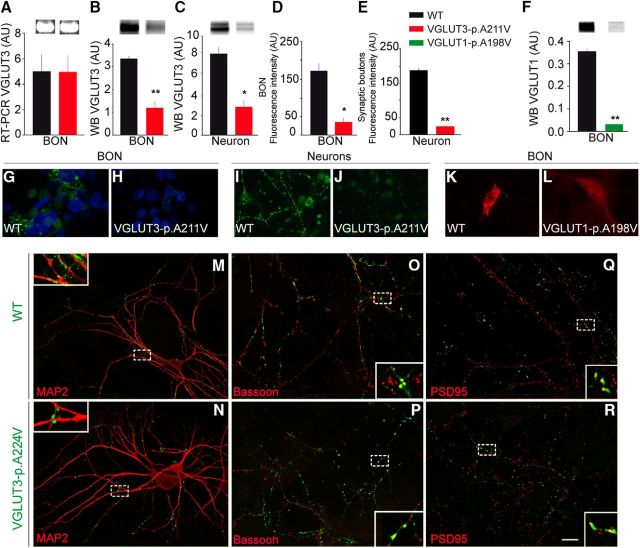
Expression of VGLUT3-p.A211V in cell cultures. A, Gel image of RT-PCR products (negative image) showing no significant difference between WT and VGLUT3-p.A211V transcript from BON cells stably expressing each allele. B, C, Western blot (WB) quantification of VGLUT3 and VGLUT3-p.A211V in BON cell extracts (B) and in primary cultures of hippocampal neurons transfected with a VGLUT3 or VGLUT3-p.A211V expression plasmid (C). VGLUT3-p.A211V expression was reduced by 64% in BON cells (B) and by 66% in neurons (C). D, E, Quantification of fluorescence intensity of WT and VGLUT3-p.A211V in stable BON cells (D) or in synaptic boutons in hippocampal neurons in culture (E). F, Western blot detection and quantification of WT and VGLUT1-p.A198V in BON cell extracts. G, H, Immunofluorescence microphotographs of VGLUT3 (green) in BON cells stably transfected with a VGLUT3 (G) or VGLUT3-p.A211V (H) expression plasmid. I, J, Hippocampal neurons transiently transfected with a VGLUT3 (I) or VGLUT3-p.A211V (J) expression plasmid. Nuclei were labeled with DAPI (blue). K, L, Immunofluorescence of the WT isoform of VGLUT1 (K, red) or VGLUT1-p.A198V (L, red) in BON cell cultures that were transiently transfected with expression plasmid. M–R, Colocalizations of VGLUT3 WT (M, O, Q, green) or VGLUT3-p.A211V (N, P, R, green) with MAP2 (M, N, red), bassoon (O, P, red), and PSD-95 (Q, R, red) in primary hippocampal neuronal cultures transfected with a VGLUT3 or VGLUT3-p.A211V plasmid. Areas surrounded by a dashed line are enlarged in the insets. Scale bars: R, 5 μm; G–L, 10 μm; M–R, insets, 1 μm. * p < 0.05; ** p < 0.01.

