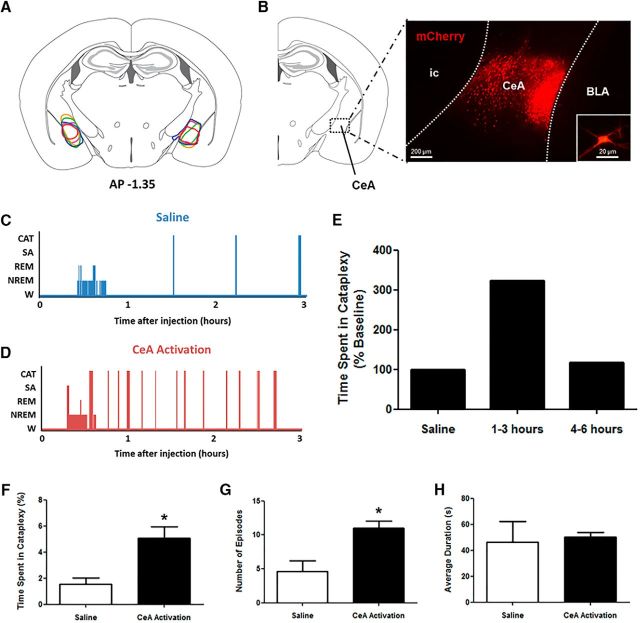
Figure 1.
CeA activation exacerbates cataplexy in narcoleptic mice. A, Stereotaxic map displaying the location of expression of the Cre-independent hM3Dq construct in the CeA of 5 orexin−/− mice. B, Extent of expression was determined on the basis of mCherry fluorescence. A representative sample of mCherry-positive neurons is shown, as is a single neuron (inset). C, D, Hypnograms displaying behavioral states of orexin−/− mice during baseline conditions (saline) or CeA activation (CNO). E, Compared with saline levels of cataplexy, CNO produced increases in cataplexy that persisted for 3 h after injection before returning to control levels, so this time frame was examined in detail. F, After global CeA activation, a large increase in the total time spent in cataplexy was observed. G, This increase in cataplexy arose from an increase in the number of cataplexy episodes mice experienced per 3 h recording. H, Average duration of cataplexy episodes did not change. W, Wakefulness; SA, sleep attacks; CAT, cataplexy. *p < 0.05 compared with saline.

