
Figure 4.
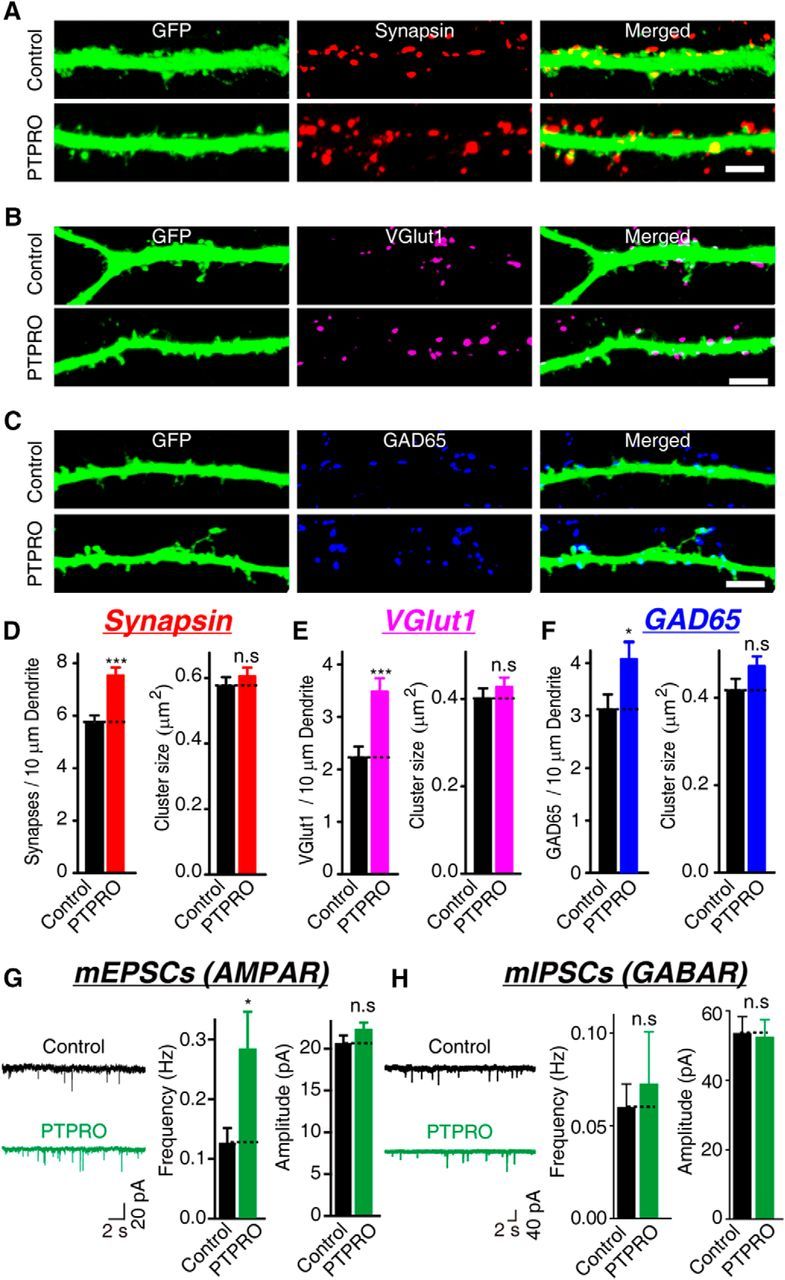
Overexpression of PTPRO increases the synapse density in cultured hippocampal neurons. A–C, Representative images of hippocampal neurons transfected with either an empty vector (control) or a vector encoding PTPRO together with pFUGW-GFP at DIV 10 and analyzed with double immunofluorescence with antibodies to GFP and synapsin 1 (A) or vGLUT1 (B) or GAD-65 (c) at DIV 14. Scale bars in A–C, 5 μm. D–F, Summary graphs of synapse density and cluster size in images in A–C. D: Synapsin: control: n = 28/3, PTPRO: n = 27/3; vGlut1: control: n = 20/3, PTPRO: n = 26/3; GAD65: control: n = 24/3, PTPRO: n = 14/3. G, H, Representative traces (left) and summary graphs of the frequencies (center) and amplitudes (right) of mEPSCs (G) recorded in 1 μm TTX and 0.1 mm PTX or mIPSCs (H) recorded in 10 μm CNQX and 1 μm TTX. G: mEPSCs: control: n = 29/3, PTPRO: n = 30/3; H: mIPSCs: control: n = 33/3, PTPRO: n = 32/3. For all representative traces and images, scale bars apply to all panels in a set. All summary graphs show the mean ± SEM; statistical comparisons were made with Student's t test (*p < 0.05; ***p < 0.001; n.s., not significant).