Figure 2.
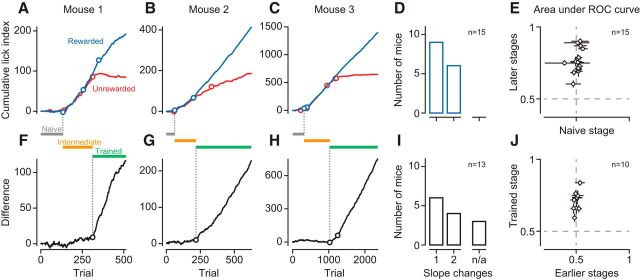
Orientation discrimination learning is characterized by a sequence of distinct stages. A–C, Cumulative LIs across trials to the rewarded (blue) and the unrewarded (red) stimulus for 3 example mice (M22, M28, M42). Circles indicate significant change points. C, The second to last slope change for the unrewarded stimulus is concealed by the large number of trials but becomes evident in the difference (H). D, Distribution of the number of change points for the rewarded stimulus across mice (n = 15). E, Ideal-observer analysis decoding stimulus presence from lick rates in naive versus later (intermediate and trained) stages. F–H, Same as A–C, difference in cumulative LIs for rewarded and unrewarded orientations. I, Same as D, for the difference in cumulative LIs across mice. n/a, Number of animals that failed to learn. J, Ideal-observer analysis decoding stimulus orientation from LIs in early (naive and intermediate) versus trained stages. Data points indicate individual mice. Error bars indicate 95% CIs.

