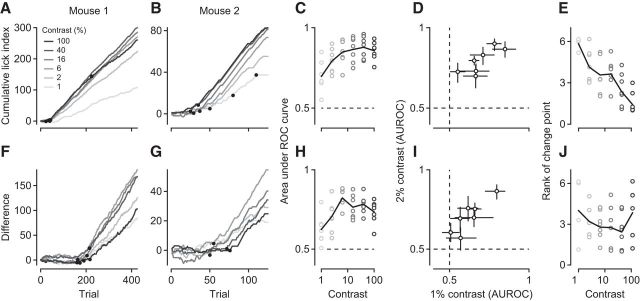
Figure 3.
Orientation discrimination performance at different levels of stimulus contrast. A, B, Cumulative LIs in response to the rewarded stimulus at different contrast levels for 2 example mice (M110, M42). Black dots indicate significant change points. C, Area under the ROC curve as a function of stimulus contrast. At each contrast level, stimulus presence is decoded from lick rates in the intermediate and trained stage. Circles represent individual animals. Black line indicates the mean across animals. D, Same analysis as in C, but showing contrast levels of 1% versus 2% only. Error bars indicate 95% CIs. E, Rank of the first change point in the cumulative LIs as a function of stimulus contrast. Black line indicates the mean rank across animals. F, G, Same as A, B, but for difference in cumulative LIs to rewarded and unrewarded stimuli. H, Same as C, decoding stimulus orientation from LIs in the trained stage. I, Same as D, for data in H. J, Same as E, for change points extracted from the difference in LIs. N = 7 mice.

