Figure 4.
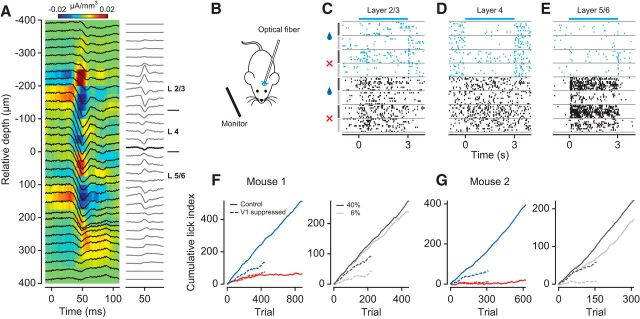
Transient optogenetic suppression of V1 neurons impairs behavioral performance. A, Left, LFP (black traces) superimposed on the CSD profile. Right, CSD traces. Bold line indicates the base of layer 4. B, V1 activity was suppressed by unilateral photo-simulation of PV+ inhibitory interneurons expressing ChR2. C–E, Raster plots of three example neurons from different V1 layers (units M120-33-8, -28, -47). Cyan represents V1 suppression by PV+ photo-activation. Black represents control condition. Stimulus conditions are separated by gray horizontal lines. Symbols and vertical lines on the left indicate stimulus orientation (blue drop represents rewarded; red cross represents unrewarded) and contrast (black represents 40%; gray represents 6%). F, Cumulative LIs for one mouse (M117). Left, Behavioral performance for rewarded (dark blue) versus unrewarded (red) orientation during V1 suppression (dashed lines) and in control condition (solid lines). Right, Rewarded orientation only, at 40% (black) and 6% (gray) contrast. G, Same as F, for Mouse M199.

