Figure 5.
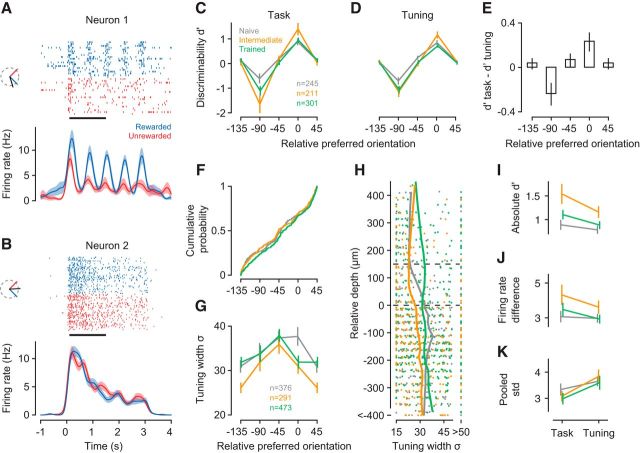
V1 neurons show improved discriminability and sharper orientation tuning already in the intermediate learning stage. A, B, Spike rasters and density functions in response to the rewarded (blue) and unrewarded (red) stimulus for two example neurons (units M22-14-16, M81-3-31). Insets, Preferred (black), rewarded (blue), and unrewarded (red) orientations. C, Neural discriminability (d′) during task performance in the naive (gray), intermediate (orange), and trained stage (green). Bins represent preferred orientation relative to the rewarded orientation. D, d′ values computed from responses to the same stimuli during orientation tuning measurements. E, Mean pairwise differences in d′ between task and tuning measurements across orientation bins. F, Cumulative distribution of relative orientation preferences across learning stages. G, Learning-related changes in tuning width as a function of orientation preference relative to the rewarded orientation, for all neurons recorded during the naive, intermediate, and trained stage. H, Tuning width (σ) and laminar location for neurons in G. Trends (vertical lines) were computed with locally weighted, robust regression (lowess). I, Absolute d′ values during task performance versus measurements of orientation tuning, separately for each learning stage. Included are only neurons from bins centered on 0 degrees or −90 degrees in C. J, Same for differences in firing rates between rewarded and unrewarded stimuli. K, Same for pooled SD; n = 11 mice; numbers of neurons per learning stage are given in C. Error bars indicate ±1 SEM.

