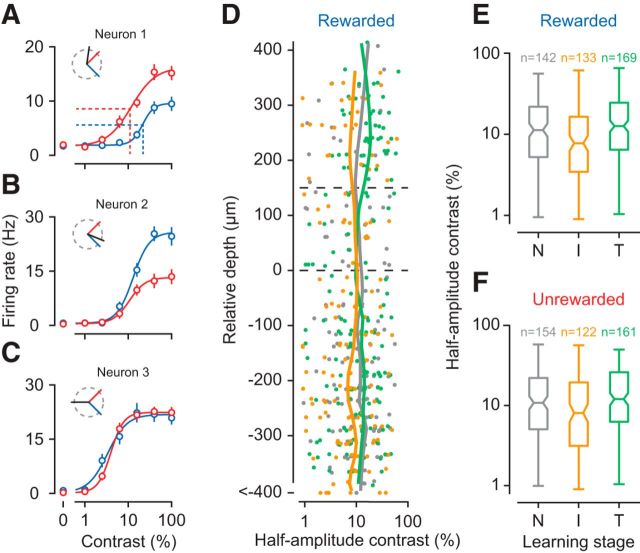
Figure 6.
Contrast sensitivity in the population of V1 neurons. A–C, Contrast responses of three example V1 neurons (units M110-30-5, M22-14-46, M154-6-15) for the rewarded (blue) and unrewarded (red) stimulus. Because the two stimuli are not identical, these contrast responses are strongly determined by the neuron's preferred orientation (inset, black line). Data are mean ±1 SEM. A, Dotted lines indicate contrast sensitivity, defined as the contrast at half the maximum response. D, Contrast sensitivity for the rewarded stimulus across the depth of cortex, separately for each learning stage. E, Summary statistics of contrast sensitivity for the rewarded stimulus. Center marks represent medians. Box edges represent the 25th and 75th percentiles. Error bars indicate the range. F, Same for unrewarded stimulus. N = 11 mice. Conventions as in Figure 5.

