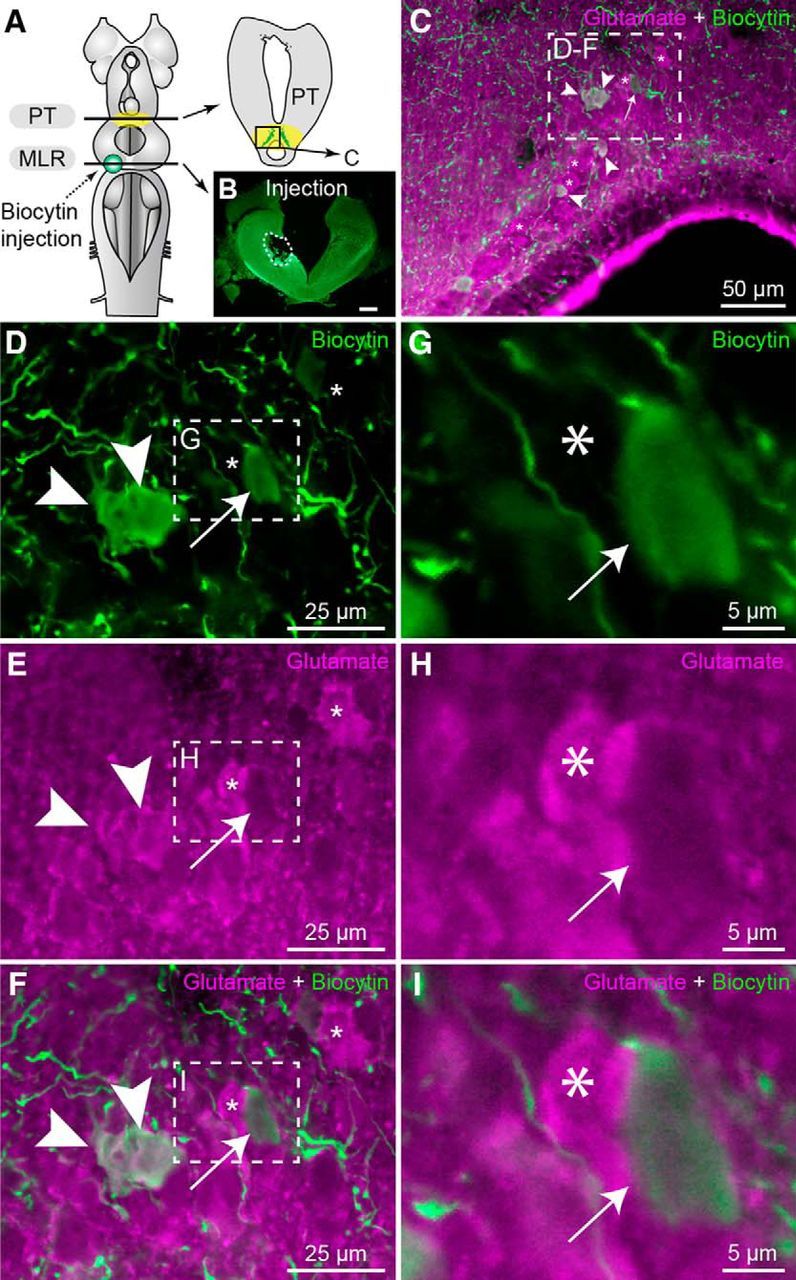
Figure 4.

Glutamatergic neurons of the PT send descending projections to the MLR. A, Schematic dorsal view of a lamprey brain. The diagram on the right illustrates a cross section at the level of the PT (homologous to the mammalian substantia nigra pars compacta) with the approximate location of the micrographs shown in C–F. B, The photomicrograph illustrates the tracer (biocytin, green) injection site (enclosed by a white dashed line) in the MLR. Scale bar, 300 μm. C, Cells labeled in the PT following biocytin (green) injection in the MLR and immunofluorescence against glutamate (magenta). D–F, Magnification of the dashed rectangle in C. G–I, Magnifications of the dashed rectangles in D–F. C–I, White arrowheads indicate retrogradely labeled cells that were immunopositive for glutamate in the PT. Asterisks denote cells positive for glutamate but not retrogradely labeled. The white arrow points to a cell retrogradely labeled but not immunopositive for glutamate.
