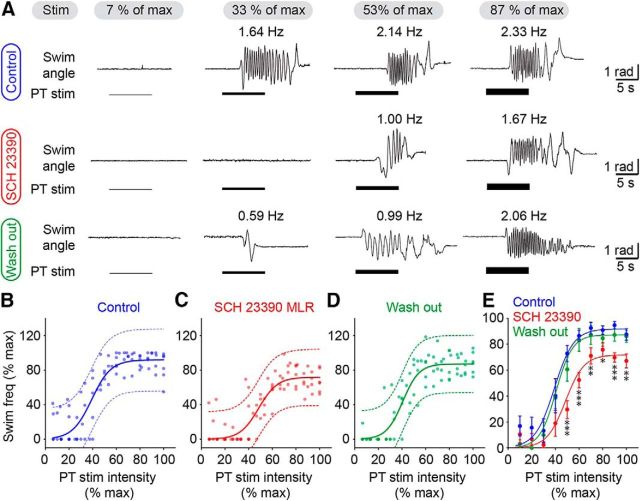
Figure 7.
Effect of D1 receptor blockade in the MLR on the graded control of swimming evoked by the PT. In a semi-intact preparation, the PT was stimulated electrically with increasing intensities. The D1 antagonist SCH 23390 was microinjected in the MLR with a Picospritzer (pipette diameter 15–20 μm; pressure: 3–4 psi; pulses: 20; duration 20–50 ms). To quantify swimming frequency, the angular variations (radians) of the body curvature were measured over time. A, From left to right, incremental PT stimulation (1–15 μA) elicited graded increase in swimming frequencies in control conditions (top), after microinjections of the D1 receptor antagonist SCH 23390 in the MLR (middle), and after a wash out period of ∼1 h (bottom). The average swimming frequency is indicated for each trial. B–D, Relationships for each condition between swimming frequency and PT stimulation intensity (1–16 μA; in each condition, n = 81 trials pooled from 6 preparations). Data followed a sigmoidal function in control condition (B, blue solid line; R2 = 0.78, p < 0.0001, frequency range 0.3–3.0 Hz), following microinjection of 0.4–1.5 pmol of SCH 23390 (0.5 mm) in the MLR (C, red solid line; R2 = 0.76, p < 0.0001, frequency range 0.3–2.4 Hz) and after wash out (D, green solid line; R2 = 0.83, p < 0.0001, frequency range 0.5–2.9 Hz). In each condition the dotted lines illustrate the 95% prediction intervals. Locomotor frequency and stimulation intensity were expressed as a percentage of their maximal values. E, Pooled data were binned as a function of stimulation intensity, with a bin size of 10%. Normalized frequencies were compared for each bin using a two-way ANOVA on ranks. *p < 0.05 against control, **p < 0.01 against control, ***p < 0.001 against control; Student-Newman–Keuls test after a two-way ANOVA on ranks for repeated measures, p < 0.001. For convenience the sigmoid fits obtained from B–D are illustrated for each condition.

