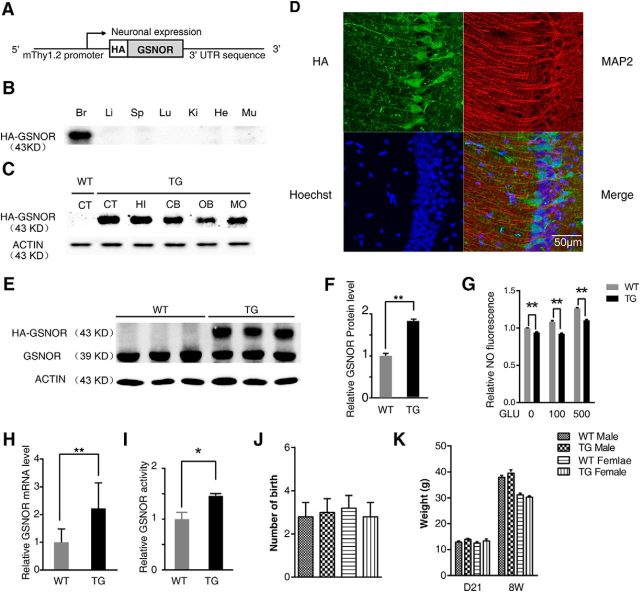
Figure 2.
Generation and characterization of TG mice overexpressing GSNOR exclusively in neurons (GNSOR TG mice). A, Schematic representation of TG mice overexpressing GSNOR exclusively in neuron constructs. B, Mouse tissue lysates were analyzed by immunoblot using anti-HA antibody. Br, Brain; Li, liver; Sp, spleen; Lu, lung; Ki, kidney; He, heart; Mu, muscle. C, Mouse brain tissue lysates were analyzed by immunoblot using anti-HA antibody. CT, Cerebral cortex; HI, hippocampal; CB, cerebellum; OB, olfactory bulb; MO, medulla oblongata. D, Immunofluorescence detection of TG GSNOR by anti-HA antibody on coronal sections of adult mouse brain. E, GSNOR protein expression in GSNOR TG mouse hippocampus using GSNOR antibody (WT, n = 3; TG, n = 3; two-tailed Student's t test, p = 0.0037). F, Quantitation of GSNOR protein levels in E. G, NO level is tested by DAF-FM-DA fluorescence probe. Primary hippocampal neuron derived from WT and TG mice was treated by GLU (100 or 500 μm) for 10 min (n = 4 experiments, one-way ANOVA, p < 0.01). H, Real-time PCR demonstrates relative GSNOR mRNA level in mouse hippocampus (WT, n = 4; TG, n = 4; two-tailed Student's t test, p = 0.0061). I, Relative GSNOR enzyme activity in GSNOR WT and TG mouse hippocampus (WT, n = 4 mice; TG, n = 4 mice; two-tailed Student's t test, p = 0.045). J, Number of birth of GSNOR TG mice (WT, n = 5 mice; TG, n = 5 mice). K, Measurements of body weight of TG mice and age-/sex-matched WT-mice at 21 d and 8 weeks (male: TG, n = 15–21 mice, WT, n = 15–19 mice; female: TG, n = 11–21 mice, WT, n = 8–18 mice). Data are mean ± SEM. *p < 0.05, **p < 0.01.

