Figure 4.
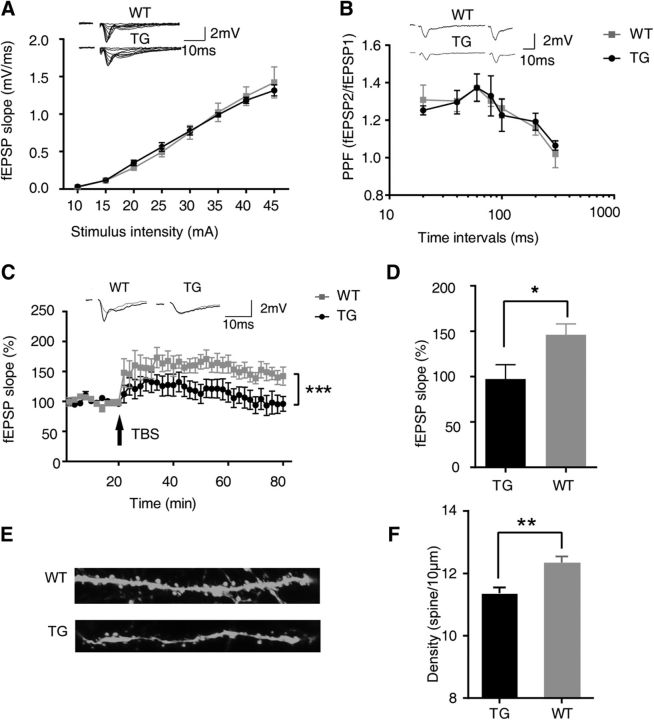
GSNOR overexpression impaired hippocampal synaptic plasticity. A, Input–output curve. Data from WT and TG slices at stimulus intensity from 10 to 45 μA. B, PPF. Data from WT and TG slices from recordings at different interval (WT, n = 10 mice; TG, n = 10 mice). C, LTP. TBS (arrow) induces LTP in WT mice but not in TG mice, indicating that GSNOR overexpression impairs hippocampus LTP in TG mice. Top, Representative traces before (gray) and after (black) TBS. Data are percentage of mean fEPSP slopes recorded during the baseline (before TBS) (TG, n = 10 mice; WT, n = 10 mice; two-way ANOVA, p < 0.0001). D, Mean ± SEM of LTP levels recorded 50–60 min after TBS. WT: 146.1 ± 12.0%; TG: 97.3 ± 15.9% (TG, n = 10 mice; WT, n = 10 mice; two-tailed Student's t test, p = 0.033). E, Representative images of hippocampal neuronal dendrite spine from Thy1:GFP-GSNOR TG mice and littermate control. F, Quantitation of dendrite spine density in hippocampal neuron from Thy1:GFP-GSNOR TG mice and littermate control (WT, n = 183 neurons form 6 mice; TG, n = 200 neurons form 6 mice; two-tailed Student's t test, p = 0.0003). Data are mean ± SEM. *p < 0.05, **p < 0.01, ***p < 0.001.

