
Figure 5.
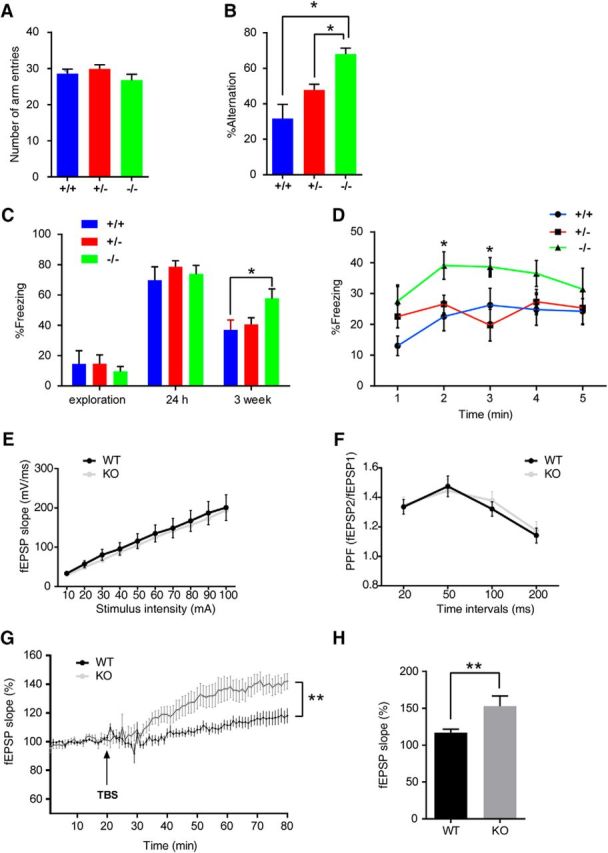
GSNOR KO mice rescued age-related cognitive impairment (GSNOR KO mice, 22-month-old, male, +/+, n = 8 mice; +/−, n = 9 mice; −/−, n = 9 mice). A, Number of arm entries that mice explored the Y-maze during 8 min. B, Percentage alternations among Y-maze arms that mice showed during 8 min exploration: one-way ANOVA, p = 0.014 (+/+ vs −/−); p = 0.047 (+/− vs −/−). C, Percentage time of mice spent freezing at exploration, 24 h, 3 weeks after context training in a fear-conditioning task: one-way ANOVA, p = 0.028 (+/+ vs −/−). D, The freezing time of every minute in the 3 weeks retention test: one-way ANOVA, p = 0.019 (+/+ vs −/−, 2 min); p = 0.027 (+/+ vs −/−, 3 min). E, Input–output curve. Data from WT and KO slices at stimulus intensity from 10 to 100 μA. F, PPF. Data from WT and KO slices from recordings at different intervals (WT, n = 12 slices form 4 mice; KO, n = 11 slices from 4 mice). G, LTP. Data are the percentage of mean fEPSP slopes recorded during the baseline (before TBS) period (WT, n = 12 slices form 4 mice; KO, n = 11 slices from 4 mice; two-way ANOVA, p < 0.0001). H, Mean ± SEM of LTP levels recorded 50–60 min after TBS (two-tailed Student's t test, p = 0.018). Data are mean ± SEM. *p < 0.05, **p < 0.01.