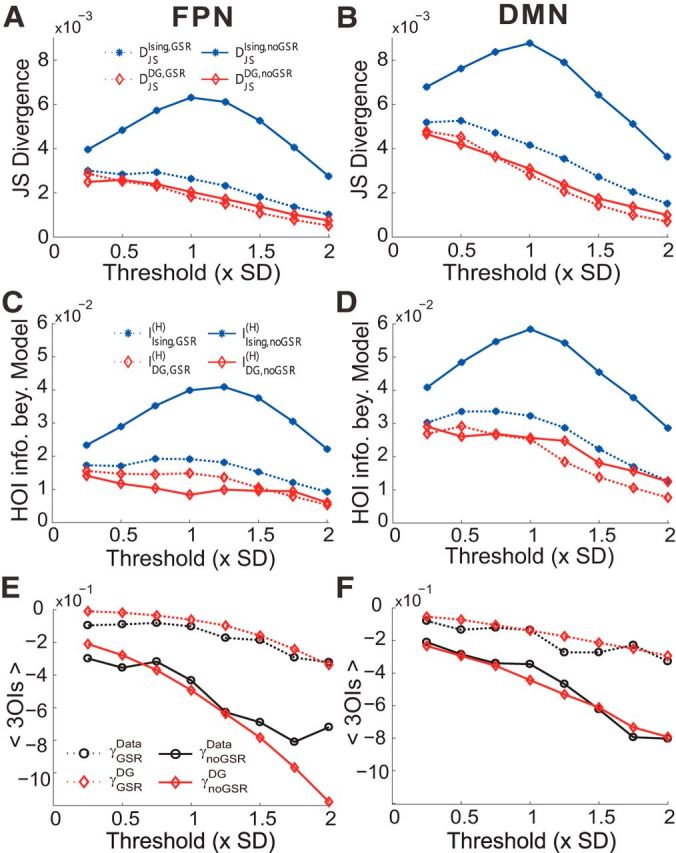
Figure 3.

Three quantitative measures of the HOIs in the data with and without GSR. The JS divergences in predicting pattern probabilities (A, B) and the higher order information beyond models (C, D) are plotted as a function of the thresholding level for the FPN (A, C) and the DMN (B,D). Results are shown for both the Ising (blue stars) and the DG (red diamonds) models. E, F, Mean strengths of 3OIs observed in the empirical data (black circles) and corresponding DG model (red diamonds) plotted as a function of the thresholding level for the FPN (E) and the DMN (F). Dotted lines indicate GSR; solid lines, noGSR. Note that both the JS divergence and higher-order information beyond models decrease with the threshold is due to fewer active patterns occurred with higher thresholds and the mean strengths of 3OIs were calculated based on actually occurred activity patterns. The binary data used here were extracted based on 10-mm-radius ROIs.
